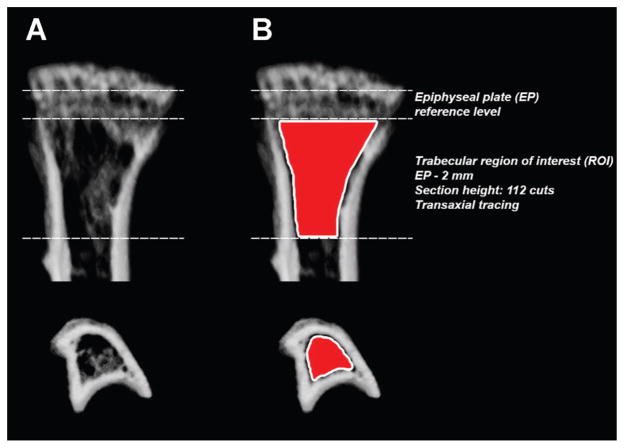
Figure 1.
Schematic of the region of interest (ROI) for 3-D trabecular bone morphometric analysis using μCT. (A) Coronal and transverse views of a representative proximal tibia. (B) Using the epiphyseal plate (EP) as a reference level, quantitative analyses of trabecular bone morphometric parameters were performed using an ROI (delineated by the Skyscan CTAn software tool using freehand drawing depicted in red) starting immediately beyond the EP and extending 112 cuts/2 mm distally by transaxial tracing.

