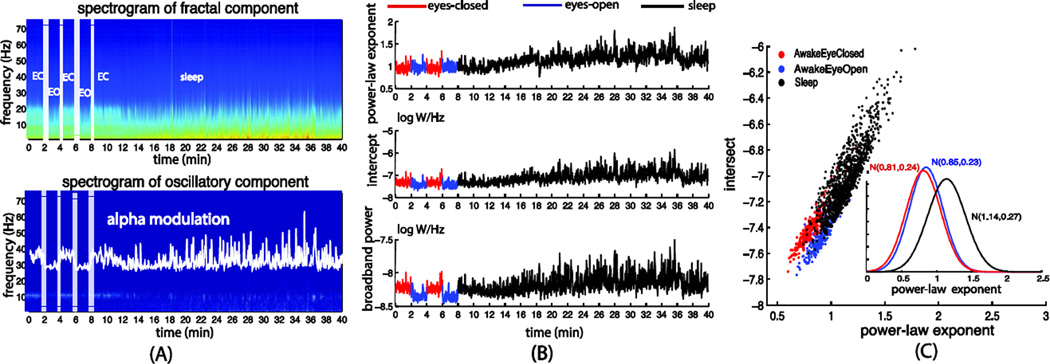
Fig. 9.
(A) Separated spectrograms of the fractal and oscillatory components averaged across all sensors underlying the human MEG signals in the eyes-closed (from 0 to 2 and 4 to 6 min periods), eyes-open (from 2 to 4 and 6 to 8 min periods) and sleep (from around 12min to the end) conditions. (B) Time courses of the power-law exponent, the log-power intercept and the broadband power derived from the power-law fitting of the fractal spectrogram. (C) Scatter plots and histograms the power-law exponent and log-power intercept in the three different states

