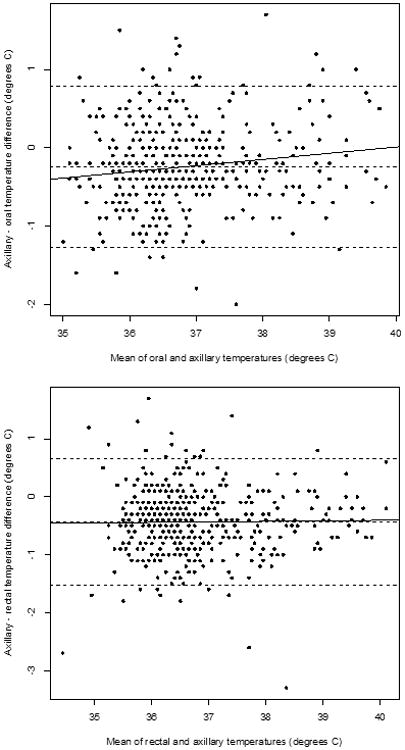
Figure 2.

Bland-Altman plots of axillary-internal temperature difference against the mean of axillary and internal temperature for oral-axillary pairs (top) and rectal-axillary pairs (bottom). The horizontal broken lines represent the mean temperature difference with the 95% CIs. The solid line is the regression line of temperature difference against mean temperature.
