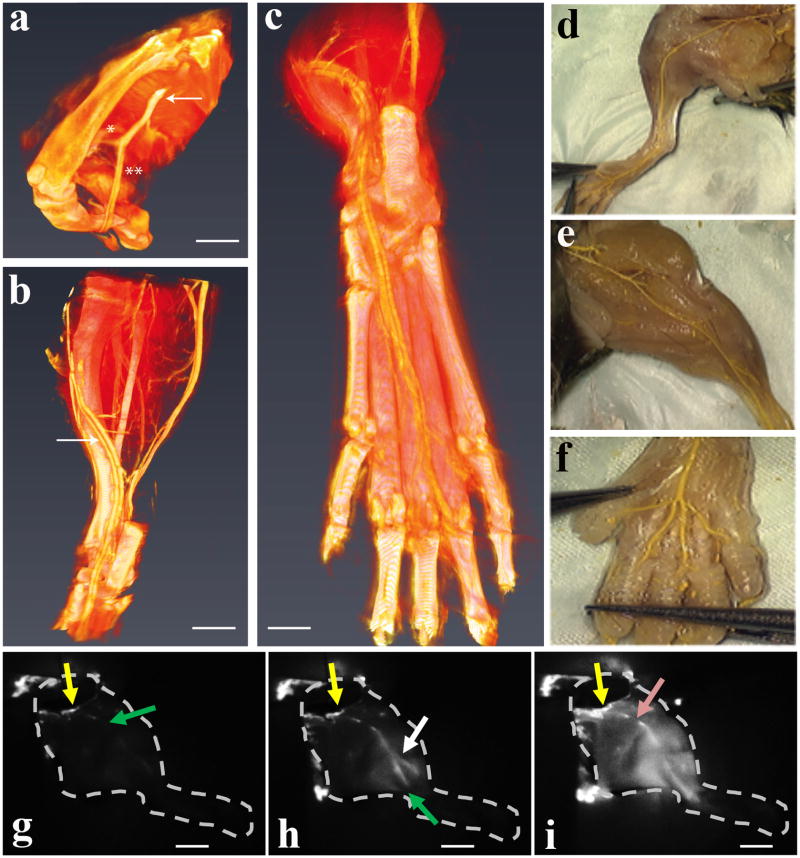
Figure 6. Perfusion of mouse lower limb after hydrogel supported end-to-end anastomosis of the femoral artery.
(a) Micro-CT 3D rendering showing contrast agent perfusion through the anastomosed site including the distal femoral artery (arrow) and its bifurcation into the fibular [*] and tibial artery [**] (scale bar = 2.5 mm). Panel (b) depicts the tibial artery (arrow) in its anatomical course within the lower leg and ankle area (scale bar = 2.0 mm). Panel (c) illustrates the most distal aspects of tibial blood supply to the footpad and individual toes (scale bar = 0.5 mm). Panel (d) depicts a dissected anastomosed limb after polymer (yellow) diffusion. (e) shows the contralateral non-anastomosed control limb. (f) shows polymer perfusion to individual toes. Panels (g-i) follows the real-time perfusion of indocyanine green (ICG) dye through the vasculature of an explanted mouse hind limb after irradiation of an implanted APC1 hydrogel. Distribution of ICG, 2 seconds (g), 7 seconds (h), and 33 seconds (i) after injection. The arrows indicate the initial site of injection (yellow), the most distal location of the dye from the injection site (green), the perfusion through another major vessel (white), and a minor obstruction (pink) that did not affect perfusion. Scale bars in panels (g-i) are 4 mm.

