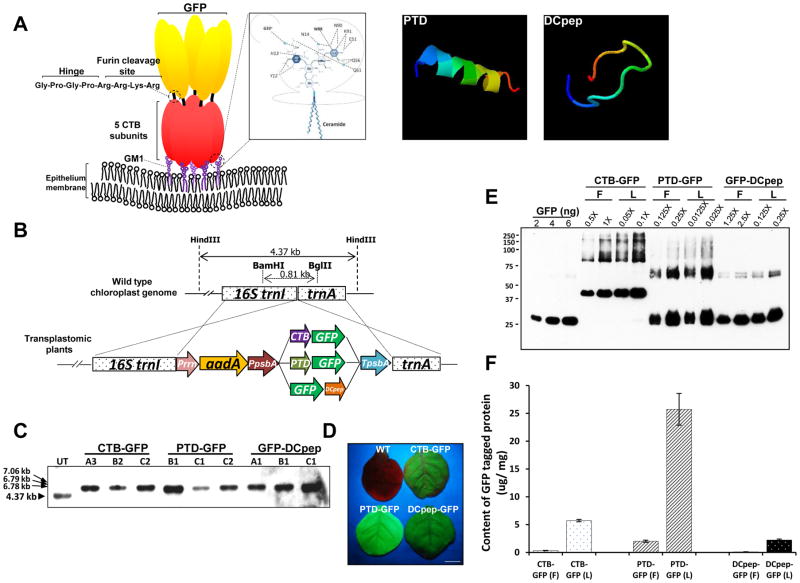
Fig. 1. Schematic diagrams for predicted protein structures and characterization of transplastomic lines expressing GFP-fusion proteins.
(A) Interaction of CTB fusion protein and GM1 receptor, and predicted 3D structure of both PTD and DCpep. Pentasaccharide moiety of GM1 receptor establishes interaction with pentameric structure of CTB. The inlet box shows atoms involved in the interaction between CTB and sugars in more detail [38]. The Hinge sequence for avoiding steric hindrance and furin cleavage site for releasing the tethered protein were placed between CTB and the fused protein. Computational predicted three-dimensional structures of both PTD and DCpep were obtained from iterative threading assembly refinement (I-TASSER) server [40]. The structure is shown in rainbow, where the color changes from blue to red gradually for residues from N-terminal to C-terminal (blue-green-yellow-orange-red). Among predicted structures, the model with the highest reliable structure for each peptide, which was chosen based on the combined results from parameter calculations such as confidence score (C-score), high-resolution models with root mean square deviation (RMSD) value, and template modeling score (TM-score), was presented. (B) Schematic diagram for expression cassette of GFP-fused carrier proteins and flanking regions. Prrn, rRNA operon promoter; aadA, aminoglycoside 3′-adenylytransferase gene; PpsbA, promoter and 5′ UTR of psbA gene; CTB, coding sequence of non-toxic cholera B subunit; PTD, coding sequence of protein transduction domain; DCpep, dendritic cell binding peptide sequence; smGFP, gene sequence for soluble-modified green fluorescent protein; TpsbA, 3′ UTR of psbA gene; trnI, isoleucyl-tRNA; trnA, alanyl-tRNA. Restriction enzymes used for Southern blot analysis were indicated as BamHI/BglII for the generation of probe and HindIII for the digestion of genomic DNA. (C) Southern blot analysis of each transplastomic line expressing GFP-fused tag proteins. HindIII-digested gDNAs were probed with the flanking region fragment described above. (D) GFP fluorescence signals from each transplastomic line were confirmed under UV light. The picture was taken after 2 months of germination. Bar represents 0.5 cm. (E) Western blot analysis for densitometric quantification with GFP standard proteins. Lyophilized (10 mg) and fresh leaf material (100 mg) were extracted in 300 μL extraction buffer. 1X represents 1 μL of homogenate resuspended in the extraction buffer in a ratio of 100 mg to 300 μL. (F) Amount of GFP fusion proteins in fresh (F) and lyophilized (L) leaves. Data are means ± SD of three independent experiments.

