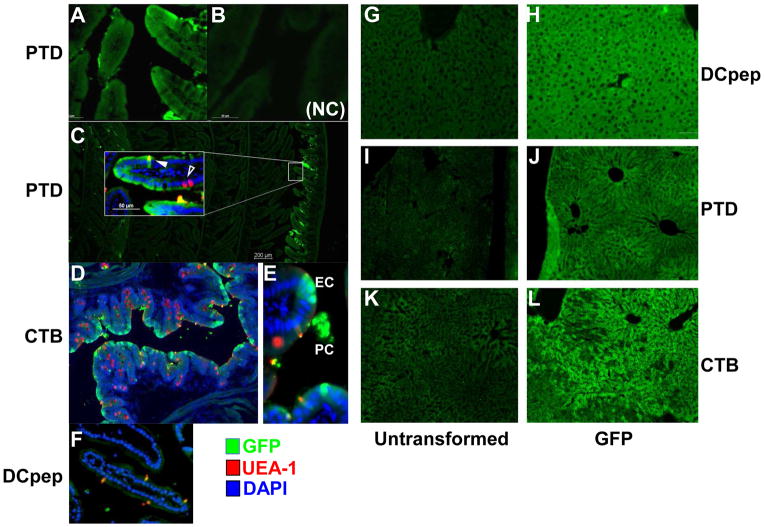
Fig. 3. Visualization of GFP in cells of ileum and liver of mice after oral delivery of plant cells.
GFP delivery to small intestine (left panel). Shown are cross-sections stained with anti-GFP (green signal; Alexa Fluor 488), UEA-1 (which stains, among other cells, M cells, red signal, rhodamine), and DAPI (nuclear stain, blue). (A–C). PTD-GFP delivery. (B) No primary antibody (NC: negative control). (D–E) CTB-GFP delivery. (F) DCpep delivery. Original magnification: 200x (A, B, D–F, insert in C) or 40x (C). GFP stain shown in liver’s cryosection (right panel), identical exposure time during image capture. The primary antibody: rabbit anti-GFP antibody at 1:1000 and second antibody: Alexa Fluor 488 Donkey Anti-Rabbit IgG was used for GFP staining. (G, I and K) liver sections of mice fed with untransformed lyophilized plant cells. (H, J and L) GFP signals of liver sections from mice fed with lyophilized plant cells expressing DCpep-GFP (H), PTD-GFP (J), and CTB-GFP (L). Original magnification: 100x.

