
Fig. 4. Biodistribution, stability and immunological response of milk exosomes.
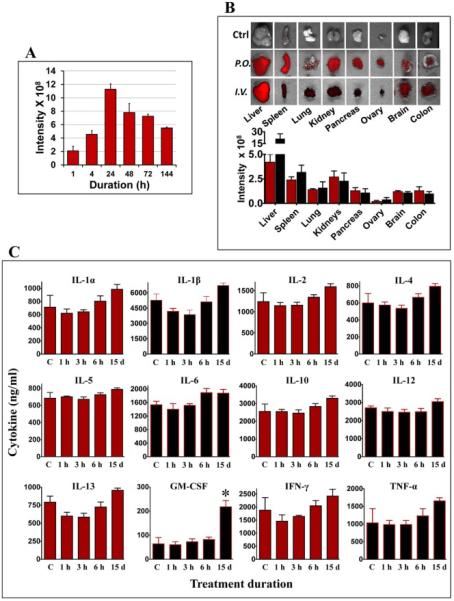
(A) Blood from nude mice treated with a single dose of 60 mg DiR-labeled exosomes by gavage (p.o.) was drawn and imaged at indicated times. Untreated control mice had baseline intensity value of < 1.25 × 10⁸ units. (B) Female nude mice were administered a single dose of 60 mg DiR-labeled exosomes/kg body weight by gavage (p.o.) or intravenously (i.v.). Top: Ex vivo-imaging of the tissues after 4 days of exosome administration were performed using Biospace lab Photon Imager Optima. Representative images are shown. Bottom: Fluorescent intensity of exosomes distributed in various tissues quantified using photon optima software. Figure shows average ± standard deviation of four animals. (C) Female Sprague-Dawley rats were treated with a single dose (short-term toxicity) of exosomes (25 mg exosomal protein/kg, b.wt.) by oral gavage or once daily for 15 days (long-term toxicity) and the serum was analyzed for cytokine levels using bio-plex cytokine Th1/Th2 assay. Acute toxicity observations were made at 1h, 3h and 6h post treatment. Vehicle-treated control (vehicle) animals were used as reference for baseline cytokine levels.