
Figure 1.
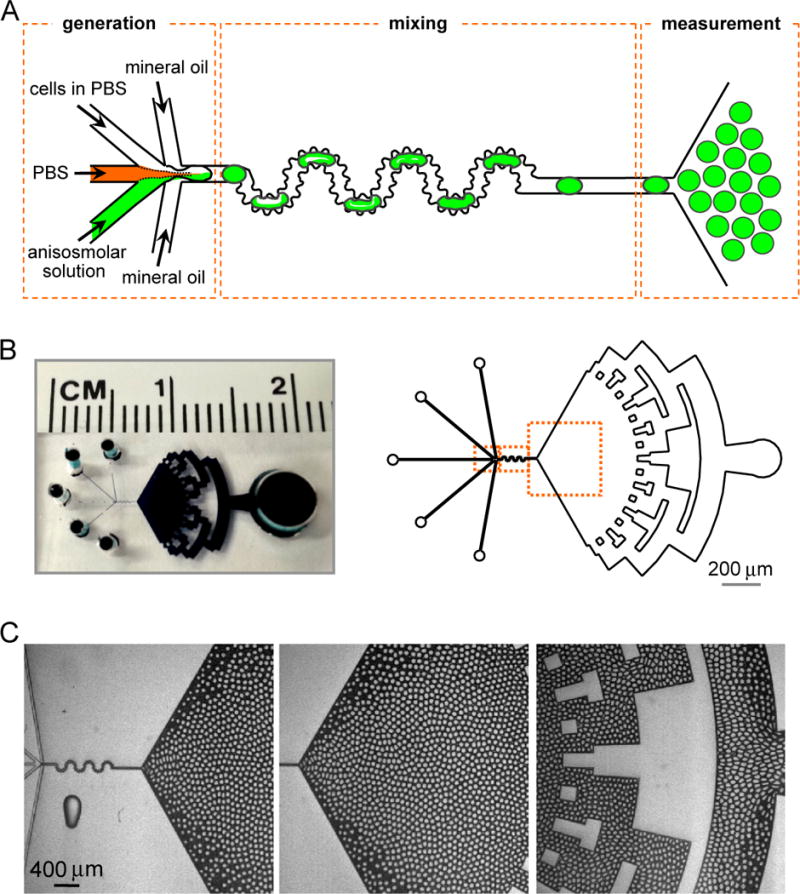
Microfluidic channel for water permeability measurement. A. Channel design, showing generation of droplets, mixing area and triangular measurement area. B. Photograph of dye-filled channel (left) and diagram of entire channel (right) showing injection ports and a symmetrically repeated microstructure for fluid exit. C. Light micrographs showing generation of monodisperse droplets (left), stable droplet pattern in the observation area (center), and symmetrical pattern formation during fluid exit (right) (see related Supplementary Videos SV1 and SV2).