
Figure 3.
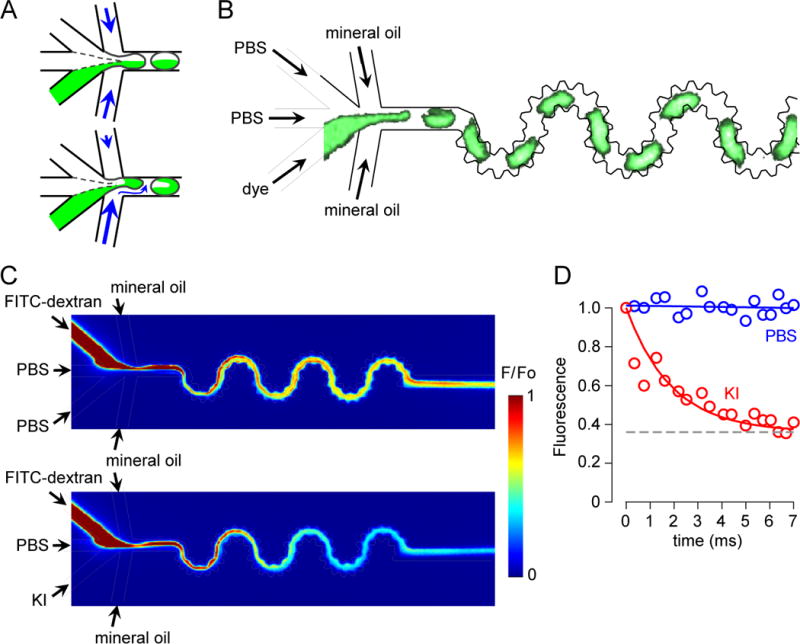
Mixing time determination from the kinetics of FITC-dextran quenching by iodide. A. Schematic showing mixing of solutions within droplets formed using equal (top) and unequal (bottom) flow rates. The unequal flow rate condition enhances mixing efficiency. B. Fluorescence micrograph of droplet generation and mixing. Calcein (1 μM), PBS (upper), PBS (center channel), mineral oil (top) and mineral oil (bottom) were injected at flow rates of 200, 100, 100, 300 and 600 μl/h, respectively. Droplet images were captured at 1000 Hz (see related Supplementary Video SV3). C. Perfusates were FITC-dextran (1 μM) (upper), PBS or 500 mM KI (lower), PBS (center channel), mineral oil (top) and mineral oil (bottom) at flow rates of 200, 200, 100, 250 and 450 μl/h, respectively. Pseudocolor images of the droplet generation and mixing regions with side channel perfused with PBS (control, no fluorescence quenching) (top) or 500 mM KI (bottom). D. Area-integrated fluorescence with exponential regression (t1/2 ~ 2 ms) for KI curve.