
Figure 4.
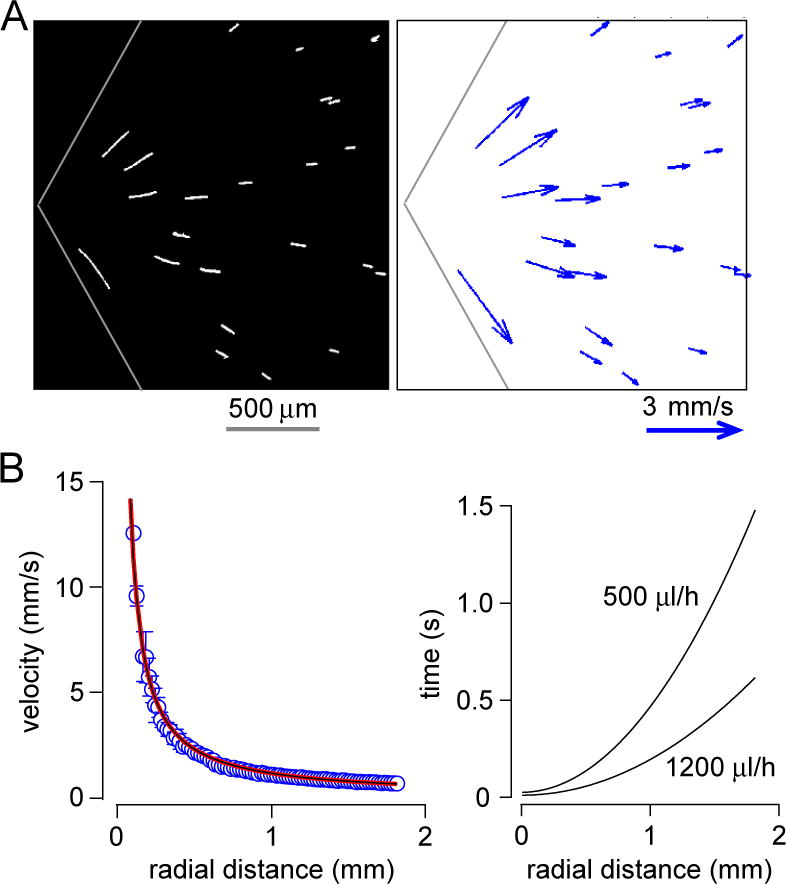
Velocity field determination by streak-line analysis. A. Streaks created by 100-ms exposure of 7-μm diameter fluorescent particles encapsulated inside droplets (left) and deduced velocity field (right). B. Velocity as a function of radial position, with fitted curve V(r)/Q = 2038/r, where Q is total flow rate (left), and deduced relationship between time and radial position shown for two total flow rates (right).