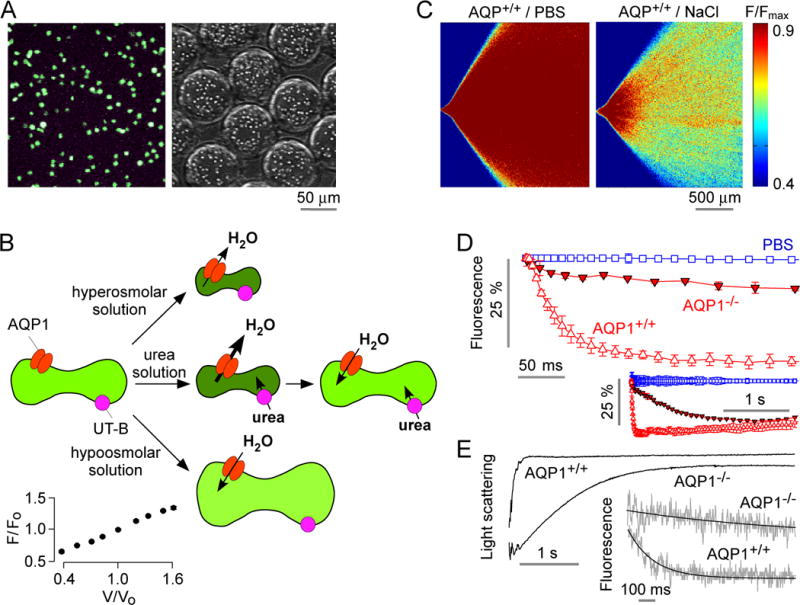
Figure 5.

Osmotic water permeability measurement in mouse erythrocytes. A. Fluorescence micrographs of calcein-loaded erythrocytes on a coverglass (left) and in aqueous droplets generated in the microfluidic channel (right). B. Schematic of measurement method in which osmotic water permeability is measured from the kinetics of cell volume changes in response to mixing of erythrocytes with an anisomolar solution; urea transport is measured from the biphasic kinetics after mixing with a hyperosmolar, urea-containing solution. Inset (lower left), relationship between calcein fluorescence and relative erythrocyte volume, as deduced from static plate reader measurements. C. The microfluidic channel was perfused with an erythrocyte suspension (from wild-type mouse) in PBS, PBS (in central channel), and PBS containing 500 mM NaCl (bottom channel), to give a 200-mM NaCl gradient. Fluorescence micrographs of the measurement region for zero (control) gradient (left) or the 200-mM NaCl gradient (right). D. Deduced time course of erythrocyte calcein fluorescence (inset shows data on a longer time scale using 2× magnification lens). Data shown from erythrocytes from wild-type and AQP1-knockout mice for the 200-mM NaCl gradient, and (from wild-type mouse) for zero NaCl gradient. Error bars (S.E.M.) were calculated from 3 different time-integrated images. E. Osmotic water permeability in erythrocytes measured by stopped-flow light scattering. Erythrocytes from wild-type and AQP1 knockout mice were subjected to a 200-mM NaCl gradient. Inset shows stopped-flow fluorescence measurement with calcein-labeled human erythrocytes.
