
Figure 6.
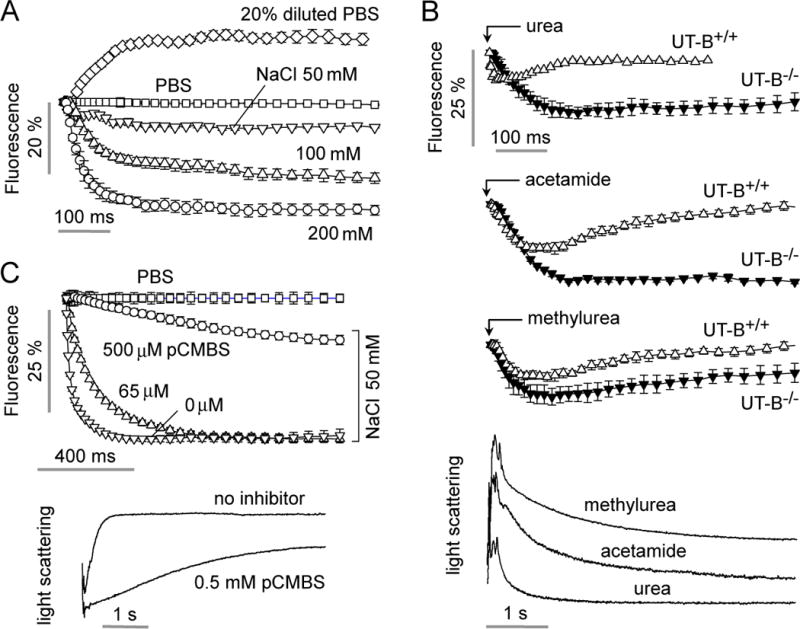
Characterization of water and urea permeability in murine erythrocytes. A. Water permeability measured as in Fig. 5D in erythrocytes from wild-type mice as a function of osmotic gradient size and direction. B. Permeability measurement of urea, acetamide and methylurea in erythrocytes from wild-type mice and mice lacking urea transporter UT-B. Flow rates were 200, 200, 100, 250, 450 μl/h, respectively, for the urea analog (500 mM in PBS) solution, erythrocyte suspension, PBS (center channel), mineral oil (top) and mineral oil (bottom). (bottom) Stopped-flow light scattering measurement of urea, methylurea and acetamide transport in mouse erythrocytes. Solute gradient was 250 mM.