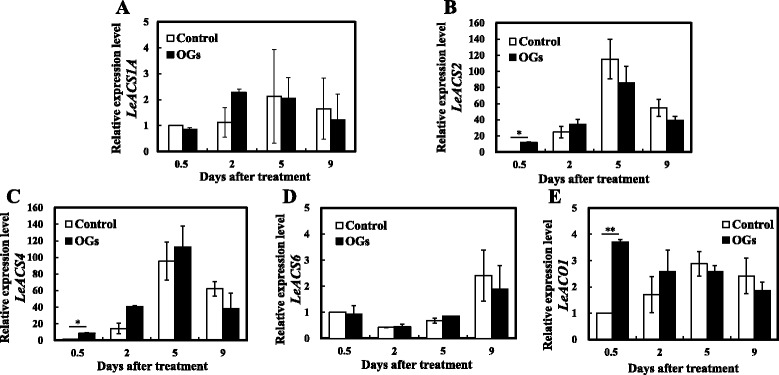
Fig. 4.

Relative expression levels of ethylene synthesis-related genes. LeACS1A (a), LeACS2 (b), LeACS4 (c), LeACS6 (d) and LeACO1 (e) gene expression values were presented relative to the Actin. Vertical bars indicate the SD (n = 3). Asterisks indicate statistically significant differences compared with the control group (*P < 0.05; **P < 0.01, Student’s t- test)
