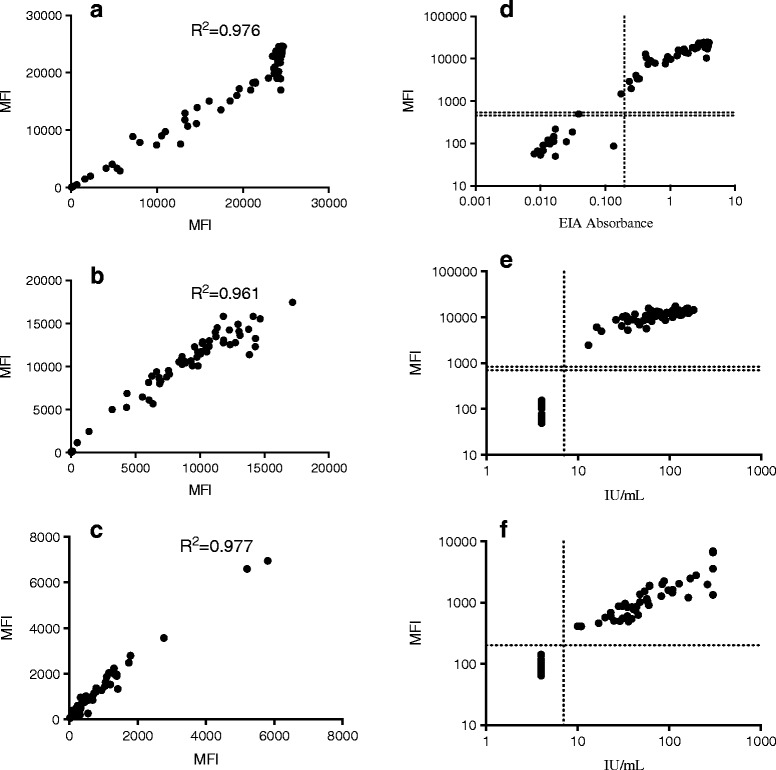
Fig. 4.

Comparison of anti-B19V, −CMV and -T. gondii IgG seroresponses by multiplex and singleplex SIAs/EIA. The left figures (a), (b) and (c) represented B19, CMV and T. gondii IgG responses by multiplex SIAs (y-axis) and singleplex SIAs (x-axis), respectively. The right figures (d), (e) and (f) represented B19V, CMV and T. gondii IgG responses by multiplex SIAs (y-axis) and the corresponding reference EIA/ELFA (x-axis), respectively. Horizontal dot lines indicate the cutoffs between negative and positive samples
