
Fig. 3.
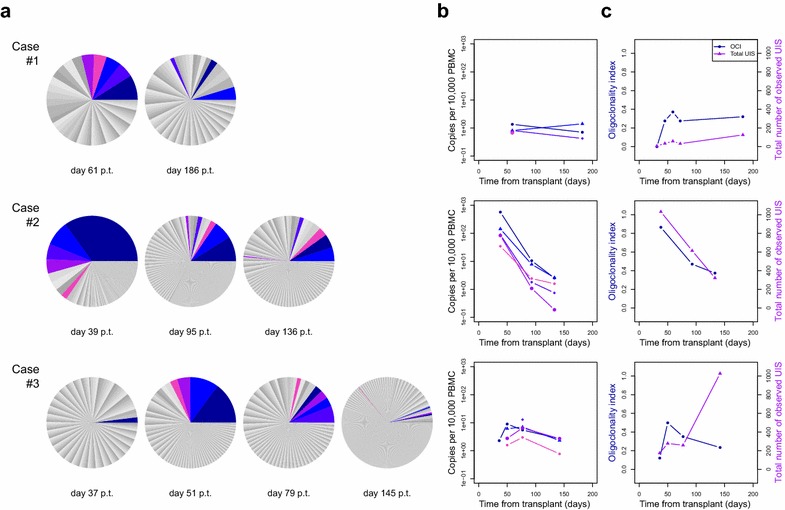
a shows the relative abundance of unique integration sites in each case at specified time points post transplantation (p.t.). b shows the change in absolute size of the 3–5 largest clones for each subject. c shows the oligoclonality index and the total number of unique integration sites for each subject over time