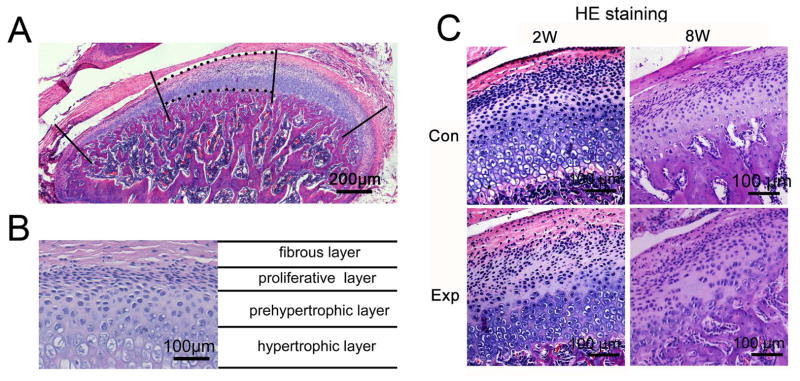
Fig. 1.
Histomorphology images of rat TMJ cartilage stained with hematoxylin and eosin (HE). A, An example of a sagittal central section of rat TMJ shows the center third of TMJ cartilage used to calculate the percentage of Cx43-positive chondrocytes. B, Cells are organized as four layers in rat TMJ cartilage as indicated. C, The representative sagittal central sections of TMJ shows the OA–like lesion, typically as a cell-free area, in 2-, and 8-week experimental groups. 2W, 2-week group; 8W, 8-week group; Con, control group; Exp, experimental group.

