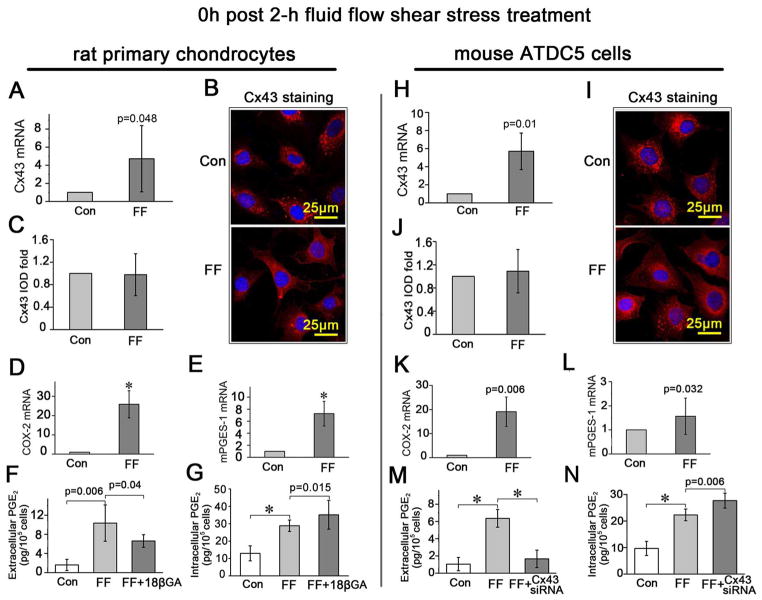
Fig. 5.
The expression of Cx43, and the synthesis and release of PGE2 were all increased upon FFSS. A, D, E and H, K, L, Comparison of the Cx43, COX-2 and mPGES-1 mRNA expression levels in primary rat chondrocytes (A, D and E) and ATDC5 cells (H, K and L) between those treated with 2-h FFSS stimulation and those without. B and I, Confocal microscopy images showed the expression of Cx43 in primary rat chondrocytes (B) and ATDC5 cells (I) with (FF) and without (Con) 2-h FFSS treatment. C and J, Quantitative analysis of integral optical density (IOD) of Cx43 expression according to the confocal images. F and M: The amount of the released PGE2 from primary rat chondrocytes with/without 18β-GA (F) or from ATDC5 cells with/without Cx43 siRNA (M), under 2-h FFSS treatment in comparison with the blank controls (Con) determined using a PGE2 EIA kit. G and N: The amount of the intracellular PGE2 from primary rat chondrocytes with/without 18β-GA (G) or from ATDC5 cells with/without Cx43 siRNA (N), under 2-h FFSS treatment in comparison with the blank controls using a PGE2 EIA kit. All samples were prepared immediately after FFSS treatment. n=3 for each experiment. Values are the mean with lower and upper limits of 95% CI. *P < 0.0001. Con, control groups; FF, FFSS treatment group.

