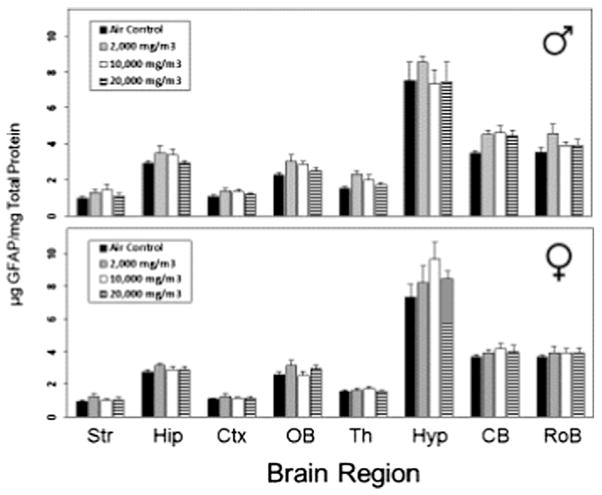
Fig. 2.
Levels of GFAP found in different regions of rat brain for rats treated with EtOH. Str: striatum; Hip: hippocampus; Ctx: cortex; OB: olfactory bulbs; TH: thalamus; Hyp: hypothalamus; Cb: cerebellum; RoB: rest of brain. Each value represents the mean ± SEM for the concentration of GFAP (μg/mg total protein). *Statistically different from air control, p < 0.05.

