
Figure 4.
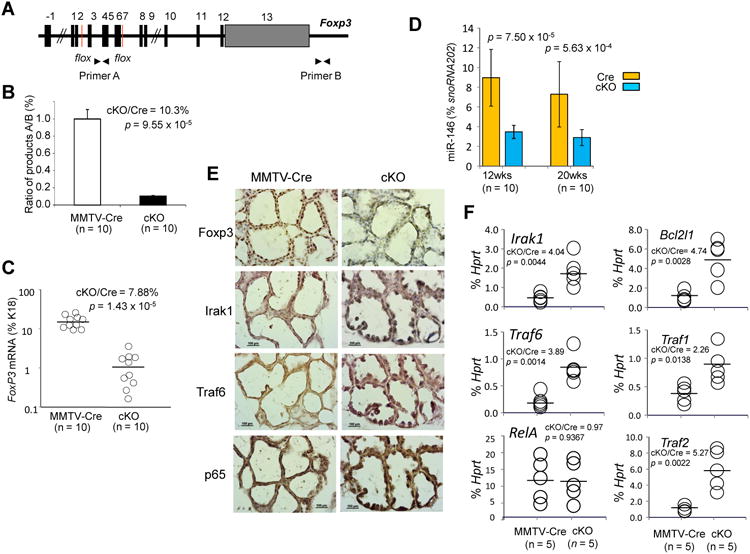
Foxp3-miR-146-NF-κB axis in mouse breast in vivo. A. Diagram of the floxed Foxp3 locus with the two primers, A and B, used to measure the ratio of deleted to undeleted alleles by PCR. B. Ratio of product A to product B DNA isolated from breast epithelial cells in mice to evaluate Foxp3 deletion (p value by a two-tailed t test). C. Quantification of relative Foxp3 mRNA levels in breast epithelial cells from mice (p value by a Mann-Whitney test). D. Quantification of miR-146a expression in breast epithelial cells from mice (p value by a Mann-Whitney test). E and F. Protein and mRNA expression of Irak1, Traf6, and p65 in breast tissue of mice 12 hours after LPS stimulation (p value by a two-tailed t test). MMTV-Cre or Cre, MMTV-Cre+FoxP3wt/wt; cKO, Foxp3cKO; cKO/Cre, ratio of levels in Foxp3cKO mice to levels in MMTV-Cre mice. Horizontal lines represent the median value. Error bar, SD. All experiments were repeated two times.