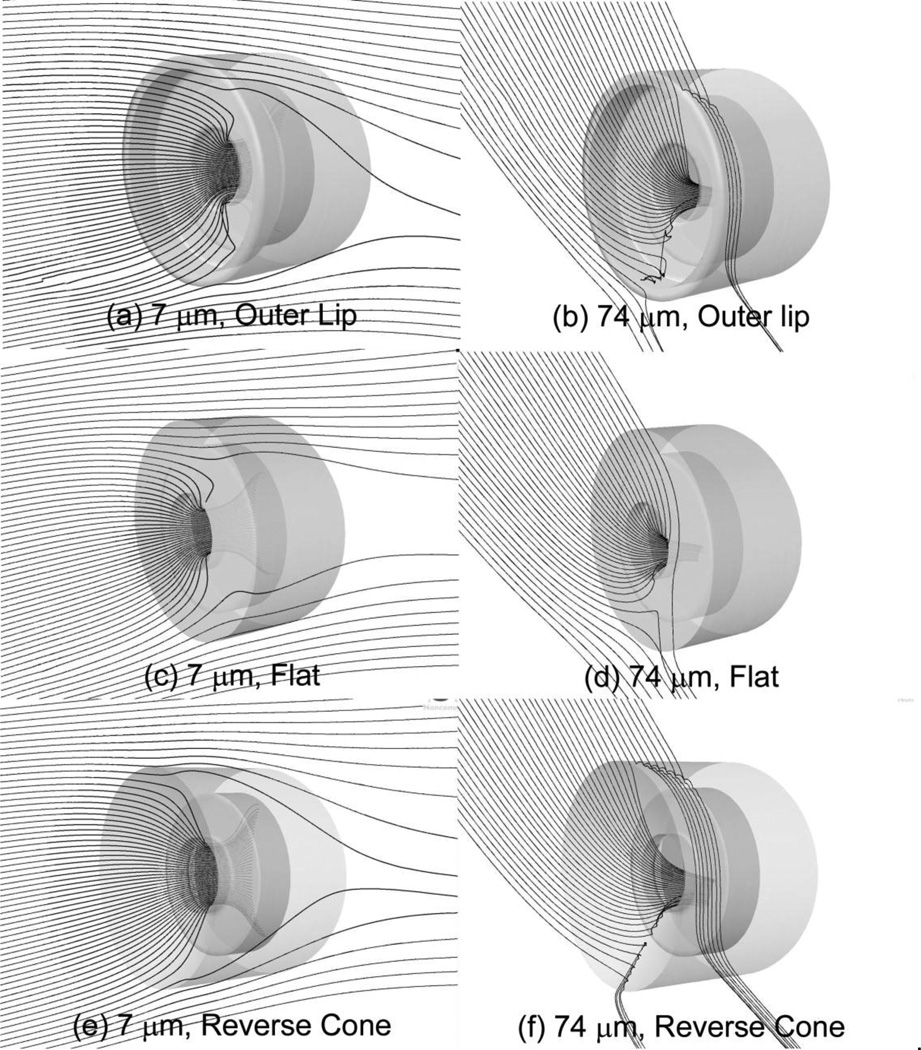
FIGURE 5.
Trajectories of unit density particles released upstream within the critical areas of the (a, b) Outer Lip, (c, d) Flat, and (e, f) Reverse Cone sampler heads, each with 15-mm single pore opening. On the left are 60 trajectories of 7 µm particles, and on the right are 40 trajectories of 74 µm particles.

