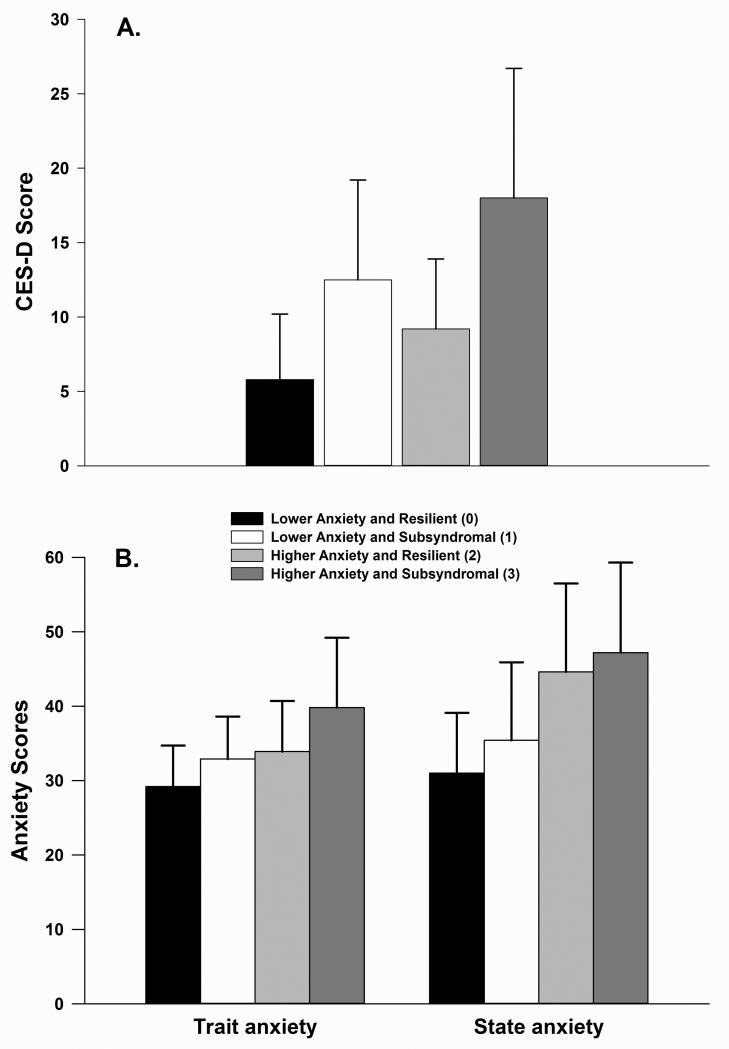
Figure 1.
Differences among the four anxiety and depressive symptom groups in Center for Epidemiological Studies Scale (CES-D) scores (A) and Trait and State Anxiety scores (B) at enrollment. All values are plotted as means ± standard deviations. For CES-D scores, post hoc contrasts revealed that group 0 < 1, 2, and 3 (all p≤.001) and that groups 1 and 2 < 3 (both p≤.031). For State Anxiety scores, post hoc contrasts revealed that group 0 < 2 and 3 (both p<.0001) and group 1 < 2 and 3 (both p≤.003). For Trait Anxiety, post hoc contrasts revealed that group 0 < 2 and 3 (both p≤.004) and that group 1 < 2 and 3 (both p<.0001).

