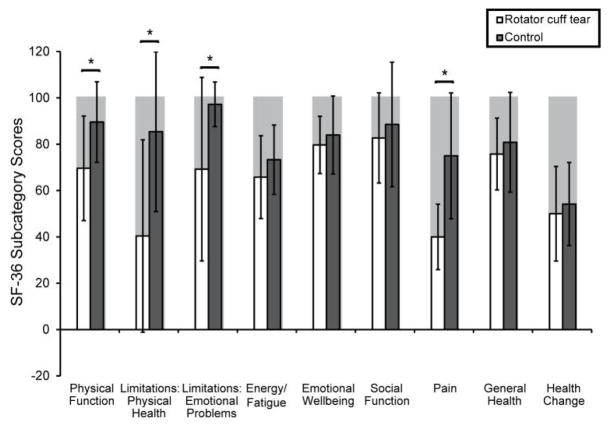
Figure 3.
Mean±SD for each subcategory score for the SF-36 for rotator cuff tear (white) and control (gray) groups. Shaded bars in background indicate the best score. The rotator cuff tear group had worse scores on all categories than controls, with significantly worse scores on the physical function (p=0.02), limitations due to physical health (p=0.01), limitations due to emotional problems (p=0.03), and pain categories (p<0.01). Note: standard deviations from this cohort are reported; it is not possible to obtain a score larger than what is indicated by the shaded gray bars in the background.

