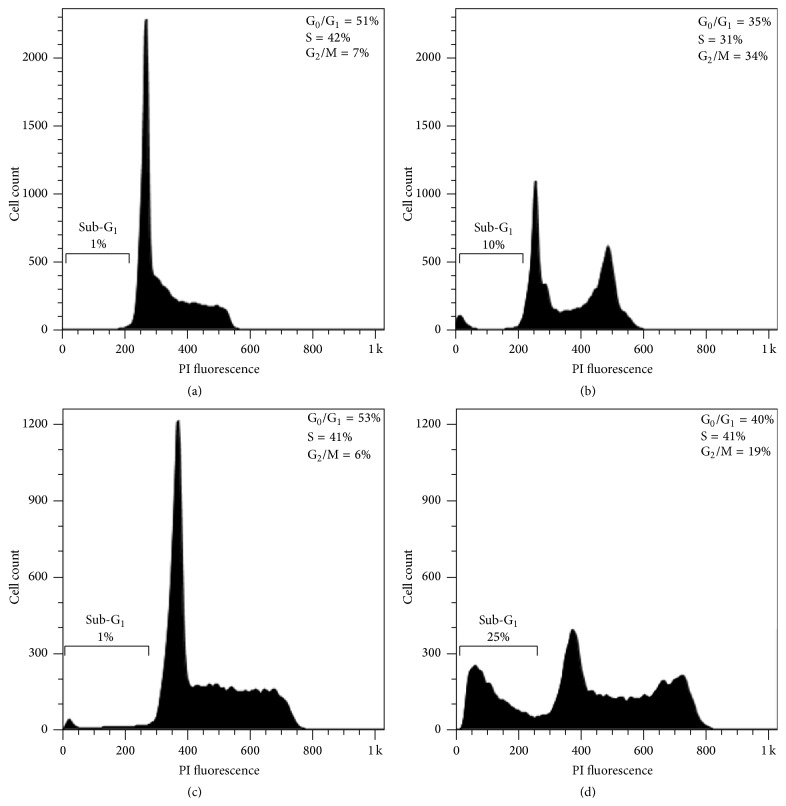
Figure 3.
CCRF-CEM and K562 cells treated with 1% ethanol (controls (a) and (c), resp.) or with 1 at 2 × IC50 ((b) and (d), resp.) for 72 h were stained with PI for cell cycle phase distribution analysis by flow cytometry. The percentages of cells in each phase, including sub-G1 (hypodiploid), are indicated.

