FIG. 2.
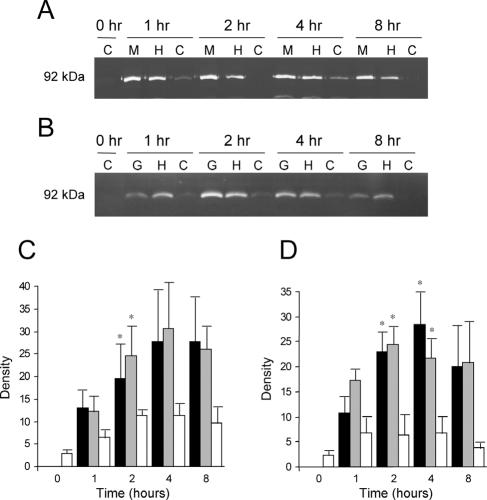
(A) Representative zymography of gelatinase B activity in monocytes stimulated with M. haemolytica products. M, M. haemolytica supernatant; H, HTCS; C, control (vehicle only) conditions. (B) Representative zymography of gelatinase B activity in monocytes stimulated with the following: G, M. haemolytica recombinant Gcp; H, HTGcp; C, control conditions. (C) Densitometric analysis of zymography gels from four separate experiments, showing the mean density (± SEM) of gelatinase B from monocytes stimulated with CS (black), HTCS (gray), or control (vehicle only) conditions (white). (D) Densitometric analysis of zymography gels from four separate experiments, showing the mean density (± SEM) of gelatinase B from monocytes stimulated with recombinant Gcp (black), HTGcp (gray), or under control conditions (white). *, significant difference from control at the same time point (P < 0.05).

