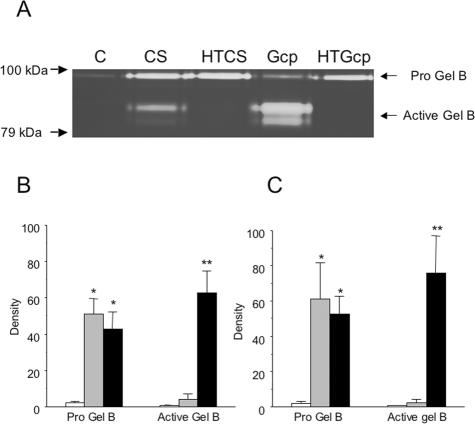
FIG. 3.
(A) Representative zymography of gelatinase B activity in bovine neutrophil releasates from cells stimulated with M. haemolytica CS, HTCS, Gcp, HTGcp, or control conditions (vehicle only) for 30 min in vitro. Bands of approximately 82 kDa, indicative of activated gelatinase B, were prominent in releasates from cells stimulated with active but not heat-treated M. hemolytic products. (B) Densitometric analysis of zymography gels from six separate experiments, showing the mean density (± SEM) of gelatinase B from cells stimulated under control conditions (white bars) or with HTCS (gray bars) or CS (black bars). Stimulation with M. haemolytica products induced extensive release of gelatinase B in relation to the level released under control conditions. (C) Densitometric analysis of zymography gels from four separate experiments, showing the mean density (± SEM) of gelatinase B from cells stimulated with control (white bars), HTGcp (gray bars), or Gcp (black bars). *, significantly higher levels of progelatinase B than under control conditions (P < 0.05); **, significantly higher levels of active gelatinase B than for control or under heat-treated conditions (P < 0.05). Gel, gelatinase; Pro Gel, progelatinase.

