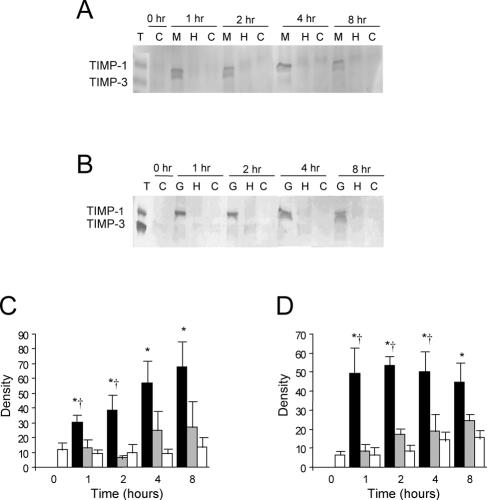
FIG. 4.
(A) Composite reverse zymography of TIMP activity in monocytes stimulated with M. haemolytica products. M, M. haemolytica supernatant; H, HTCS; C, control (vehicle) conditions. Purified mouse TIMPs (T) were run as standards. (B) Composite reverse zymography of TIMP activity in monocytes stimulated with recombinant M. haemolytica Gcp (G) or HTGcp (H) or under control (vehicle) conditions (C). Purified mouse TIMPs (T) were run as standards. (C) Densitometric analysis of reverse zymography gels from four separate experiments. Columns represent the mean density (± SEM) of TIMP-1 from monocytes stimulated with CS (black), HTCS (gray), or under control conditions (white). (D) Densitometric analysis of reverse zymography gels from four separate experiments. Columns represent the mean density (± SEM) of TIMP-1 from monocytes stimulated with Gcp (black), HTGcp (gray), or under control conditions (white). *, significant difference from control at the same time point; †, significant difference from heat-treated counterpart at the same time point (P < 0.05).

