Figure 4.
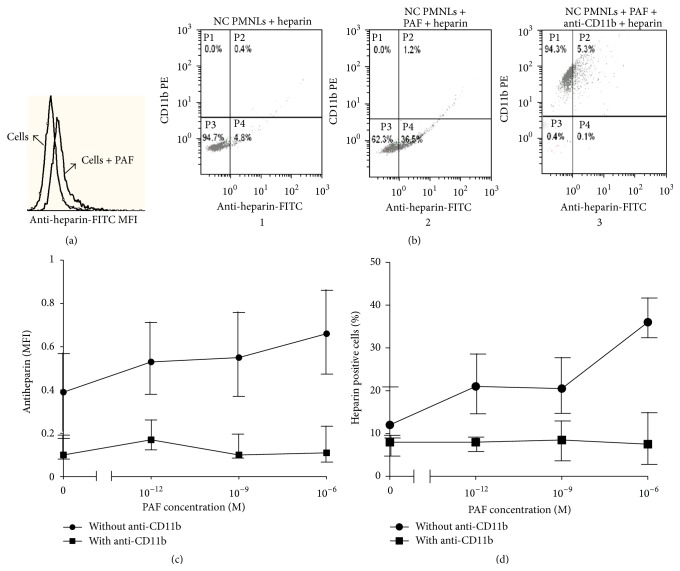
The effect of priming on heparin binding to PMNLs. (a) A representative histogram of flow cytometry, showing heparin binding intensity in NC PMNLs and NC PMNLs stimulated with 10−6 M PAF. (b) Representative histograms of flow cytometry showing percentage of heparin binding cells after incubation with 25 U/mL heparin for 30 min: NC PMNLs without PAF stimulation (1), NC PMNLs with 10−6 M PAF stimulation (2), and NC PMNLs with 10−6 M PAF stimulation and exposure to anti-CD11b-PE antibody (3). ((c), (d)) Levels of heparin bound to NC PMNLs (MFI) and percent of NC PMNLs that bind heparin, respectively, after preincubation with increasing concentration of PAF, determined by flow cytometry using specific FITC-labeled anti-heparin antibody, as described in Section 2 (●). Levels of heparin bound to PMNLs were also measured after preincubation of the cells with anti-CD11b antibodies (■) before the incubation with heparin (n = 3).

