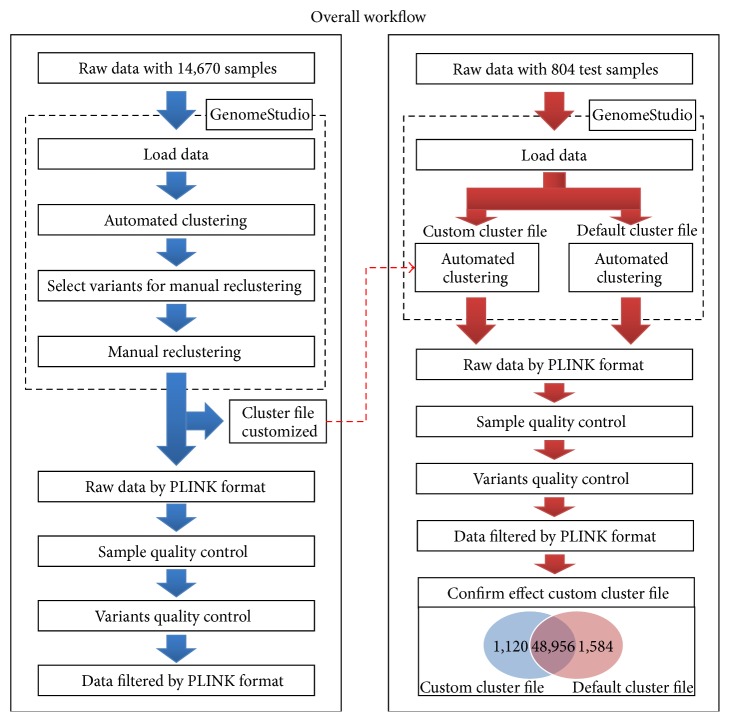
Figure 1.
Overall workflow for genotype calling using Korean exome chip data. Left panel shows data processing and analysis for 14,647 Korean samples. Right panel shows the workflow for 804 Korean samples to test the effects of customized clustering file. The Venn diagram in right panel describes the discrepancies between custom and default cluster files tested using exome chip data from 804 Korean diabetic retinopathy samples. The number in red and blue circle of Venn diagram indicates the number of variants when adjusting default and custom cluster file, respectively.

