
Fig. 6.
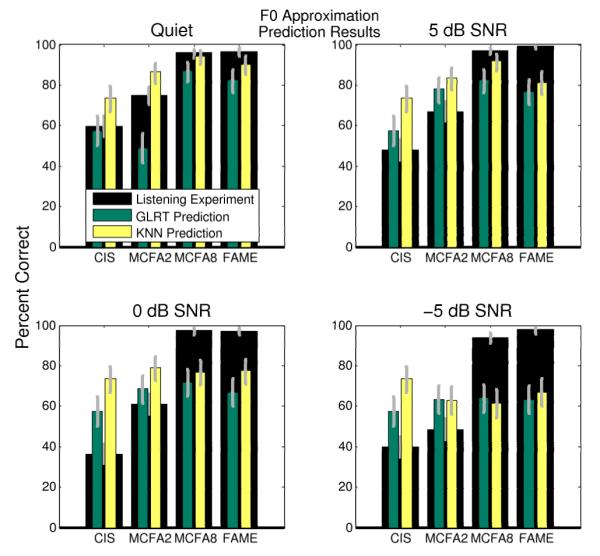
Predicted results using the F0 contour approximation method. The results are shown with the listening experiment results. The predicted results are shown in the foreground with the analogous listening experiment results shown in the background. The error bars indicate the 95% confidence interval.