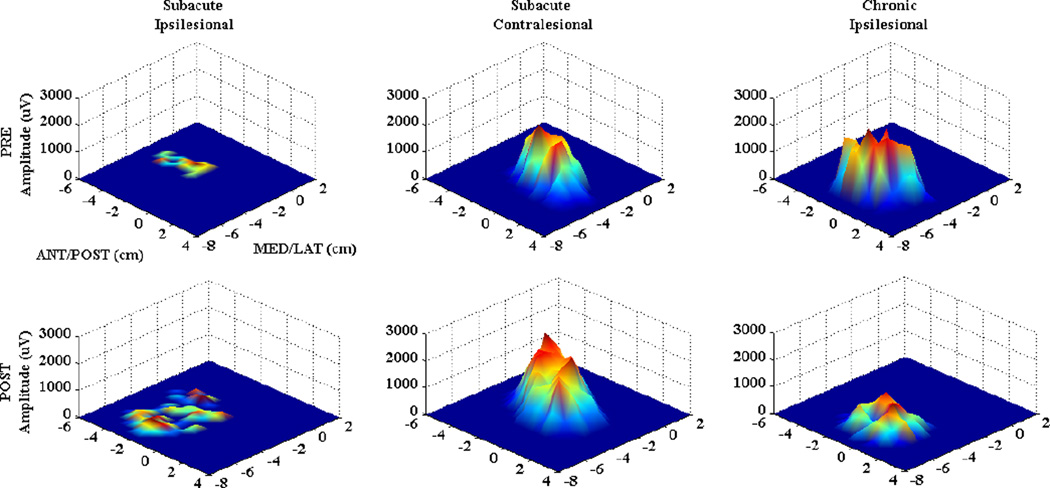
Figure 2. Single Subject Data.
MEP maps for the first dorsal interosseous (FDI) muscle in a representative subacute stroke subject (ipsilesional hemisphere (left), contralesional hemisphere (middle)) and chronic subject (ipsilesional hemisphere (right), acquired PRE (top row), and post (bottom row) intervention. X, Y axes represent medial-lateral and anterior-posterior directions, respectively. MEP amplitude is presented in microvolts (uV) on the Z axis. Ipsilesional changes in the subacute subject are characterized by increased amplitude and area, while chronic subject map shows decreased amplitude over a similar area.

