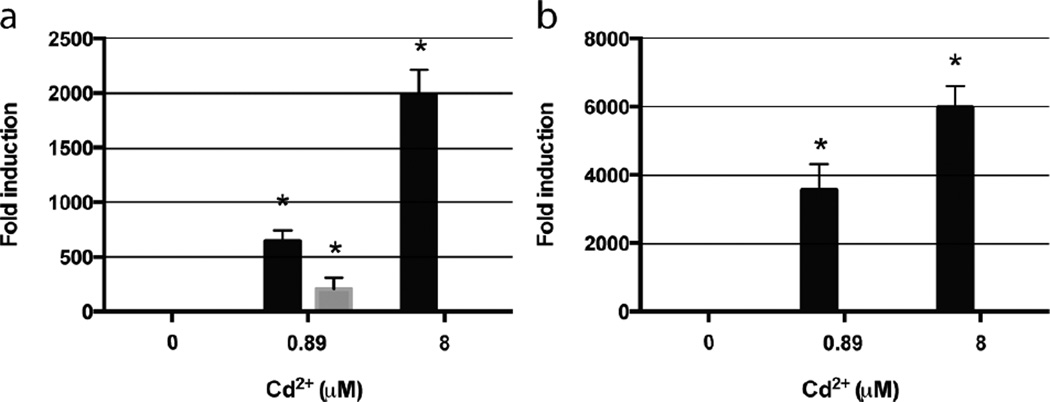
Fig. 4.
Relative expression levels of MTT5 (a) and gfp (b) genes from SB1969 (control strain) (grey bars) and GFPMTT5 strain (black bars), after Cd2+ exposure for 2h. Gene expression levels are shown relative to an untreated control (which is set at 1 ± 0.0 for every gene). Expression was normalized relative to the endogenous ATU1 (α-tubulin) gene. Each bar of the histogram corresponds to an average value of two independent experiments. Error bars represent the standard deviation. (*) : Significantly different from the control at p< 0.05.

