Fig. 5.
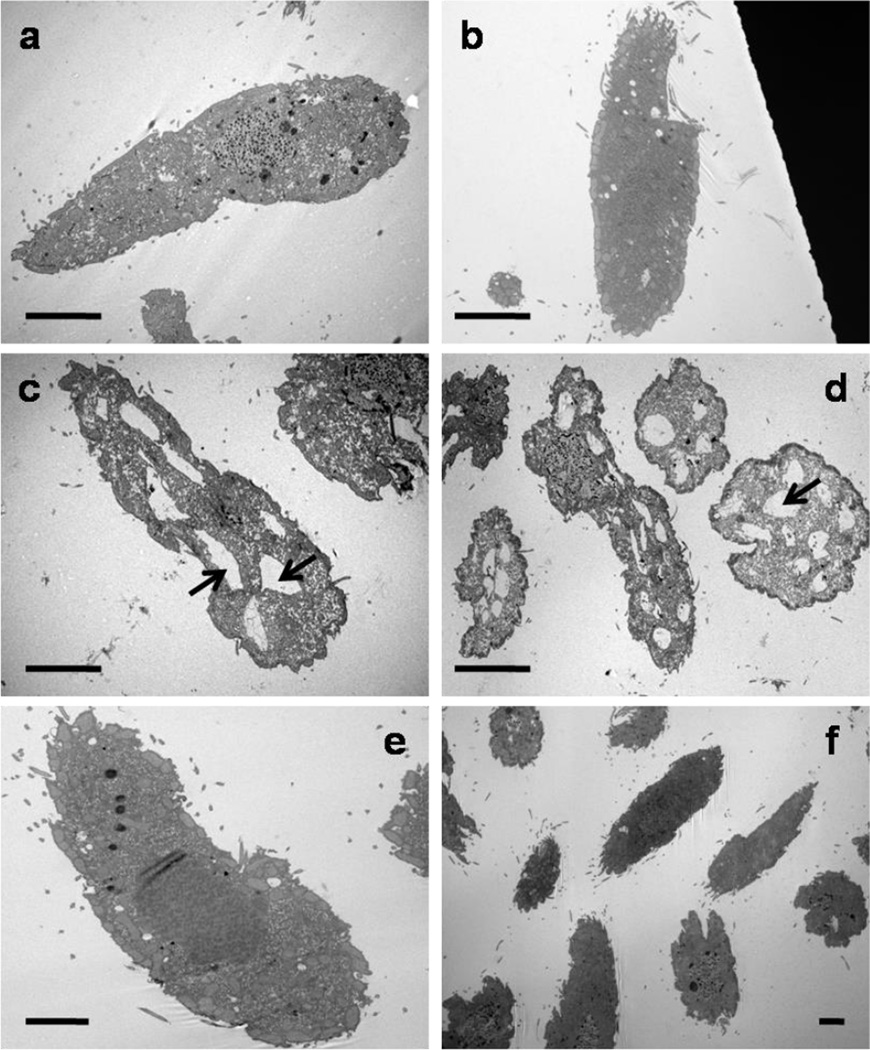
Transmission electron microscopy micrographs of SB1969 (control strain) and GFPMTT5 strain, after Cd2+ treatments (0.9 or 8 µM during 2 or 24h) or without metal treatment. (a, b) SB1969 and GFPMTT5 strains without Cd2+ treatment. (c, d) SB1969 strain treated with 0.9 µM Cd2+ for 2h. Arrows indicate an intense vacuolization. (e, f) GFPMTT5 strain after 0.9 µM (24h) or 8 µM (2h) Cd2+ treatments, respectively. Bars: 10 µm.

