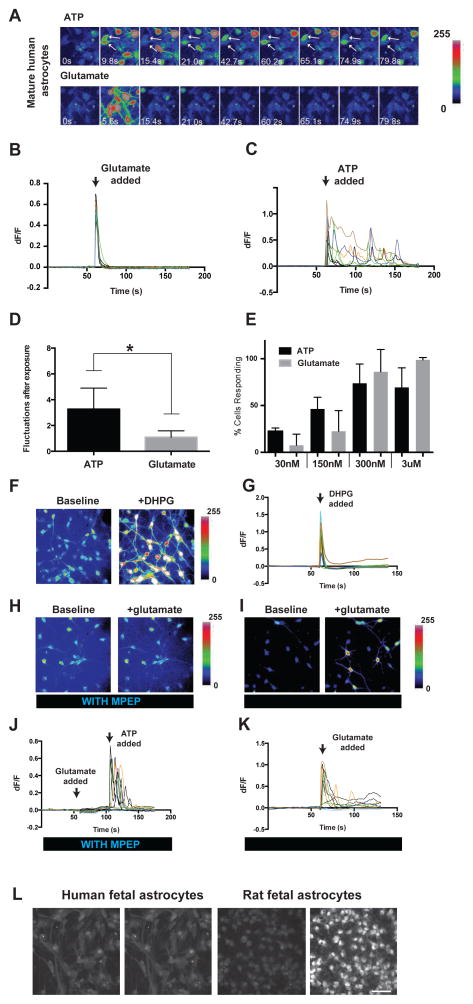
Figure 3.
Calcium responses of human astrocytes in vitro. A. Representative images of calcium responses to 3μM ATP (top) and glutamate (bottom) of mature human astrocytes (21 yo). Time is labeled in each image. Arrows point to two cells showing calcium fluctuations in response to ATP. B, C. ΔF/F of all cells in (A). Each ΔF/F trace represents a single cell. D. Average number of calcium fluctuations in human astrocytes after exposure to ATP or glutamate. N=11 movies. Concentration of ATP and Glutamate: 30nM–3μM. Two-tailed Wilconxon rank-sum test. *, p<0.05. E. Percentage of cells responding to ATP or glutamate at different concentrations. Cells with ΔF/F >5% are counted as responsive. N=3–5 movies per condition. Each movie has 5–20 cells. Data were collected from 2 patients 21 and 26 years of age, respectively. F. Fluo4-AM fluorescence of adult human astrocytes before and after addition of DHPG (200μM). G. ΔF/F of adult human astrocytes before and after addition of DHPG. H. Fluo4-AM fluorescence of adult human astrocytes before and after addition of 3 μM glutamate in the presence of 25 μM MPEP. I. Fluo4-AM fluorescence of adult human astrocytes before and after addition of 3 μM glutamate after washing out MPEP for 30 minutes. J. ΔF/F of adult human astrocytes before and after addition of 3 μM glutamate and 3 μM ATP in the presence of 25 μM MPEP. Arrowheads represent addition of glutamate or ATP K. ΔF/F of adult human astrocytes before and after addition of 3 μM glutamate after washing out MPEP. L. Representative images of calcium responses to 3μM glutamate in fetal human (17–20 gestation week, left) and rat (E18.5, right) astrocytes. Scale bar: 50μm.

