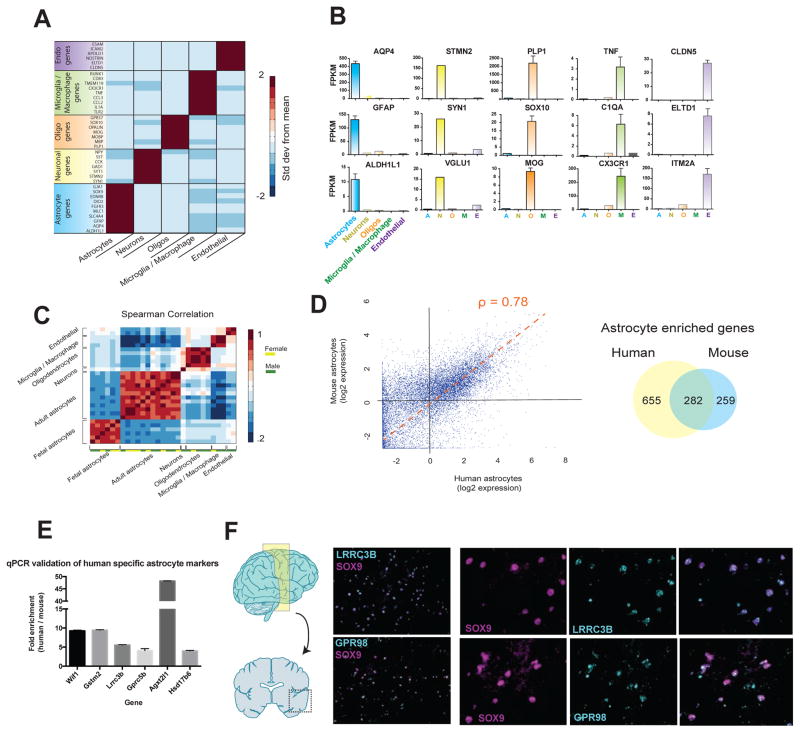
Figure 4.
RNA-seq transcriptome profiling of acutely purified human neurons, astrocytes, oligodendrocytes, microglia/macrophages, and endothelial cells. A. Expression of classic cell type-specific genes by acutely purified mature human neurons, astrocytes, oligodendrocytes, microglia/macrophages, and endothelial cells. Data represent standard deviation from mean across rows. N=12, 1, 5, 3, and 2 patients for astrocytes, neurons, oligodendrocytes, microglia, and endothelial cells, respectively. Age range: 8–63 years. B. Representative examples of the expression of cell type-specific genes by acutely purified cell samples. C. Spearman correlation between all fetal and mature samples. Fetal, n=6 patients. Age range: 18.0–18.5 gw. Mature, n=12, 1, 5, 3, and 2 patients for astrocytes, neurons, oligodendrocytes, microglia, and endothelial cells, respectively. Age range: 8–63 years. D. Scatterplot of human and mouse astrocyte gene expression. ρ represents the Spearman correlation coefficiency. Venn diagram indicates the number of astrocyte enriched genes (>4 fold, FPKM>5) for human and mouse astrocytes. Average expression data from all samples of mature human astrocytes were used for this analysis. Human, n=12 patients. Mouse, n=4 batches of astrocytes each comprising 3 mouse brains combined. Age range of human patients: 8–63 years. Age range of mice: 1–9 months. Fold enrichment in astrocytes is calculated as FPKM in astrocytes divided by the average FPKM in all the other cell types (neurons, oligodendrocytes, microglia, and endothelial cells). E. Differences in gene expression between purified human and mouse astrocytes measured using qPCR. Fold changes reflect enrichment of specific genes in human tissues. F. In situ hybridization performed on temporal lobe cortices from healthy patients (separate source from the RNAseq samples). Probes were designed against LRRC3B and GPR98 (cyan) and sections were counterstained against the astrocyte specific transcription factor, SOX9 (magenta). Scale bars: 100μm zoomed out, 50μm insets.

