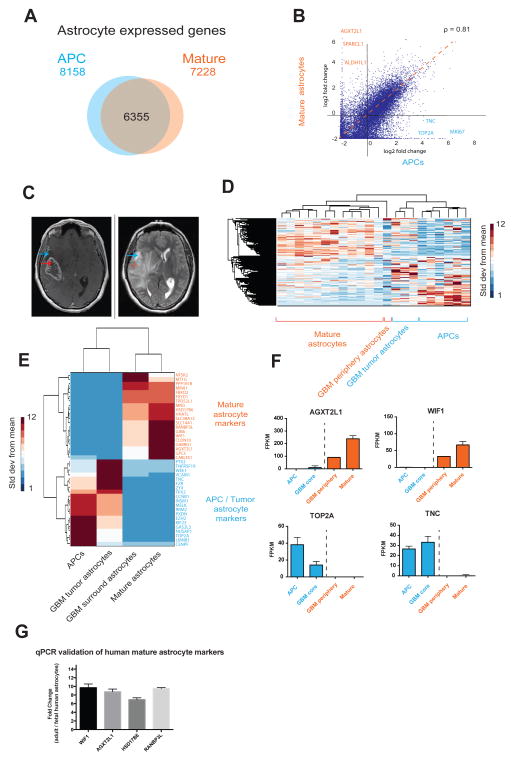
Figure 5.
The transcriptome of HepaCAM purified glioblastoma cells is more similar to APCs than mature astrocytes. A. Venn diagram of the number of genes expressed (FPKM>0.5) by APCs alone, mature astrocytes alone, and both APCs and mature astrocytes. Fetal, n=6 patients. Mature, n=12 patients. B. Scatter plot of gene expression by APCs and mature astrocytes. ρ represents the Spearman correlation coefficiency. C. MRI of a patient with a glioblastoma who underwent surgical resection shows the T1 weighted, heterogenously ring contrast enhancing core of the GBM (left) and the T2 hyperintensity of the surrounding brain (right), representing infiltrating tumor or edema. Blue arrows indicate a representative location of the peripheral tumor sample, and the red arrows indicate sample resected from the contrast-enhancing tumor core. D. Unsupervised hierarchical clustering of gene expression profiles of APCs, mature astrocytes as well as astrocytes from GBM core and peripheral regions using. Linkage; average, ColumnPdistance; Spearman, standardized across rows. Data represent standard deviation over means. E. Expression of genes that distinguish APCS and mature astrocytes in humans. Tumor core and surround astrocytes share expression patterns of APC and mature astrocyte markers, respectively. Tumor: n=3 patients. Tumor periphery: n=1 patient. F. Expression of some APC marker genes (blue) and mature astrocyte marker genes (red) in healthy and tumor samples. G. Differences in gene expression between adult and fetal human brain assessed with qPCR. Fold changes in gene expression were calculated to reflect enrichment in adult tissue (normalized to GAPDH levels).

