
Figure 1.
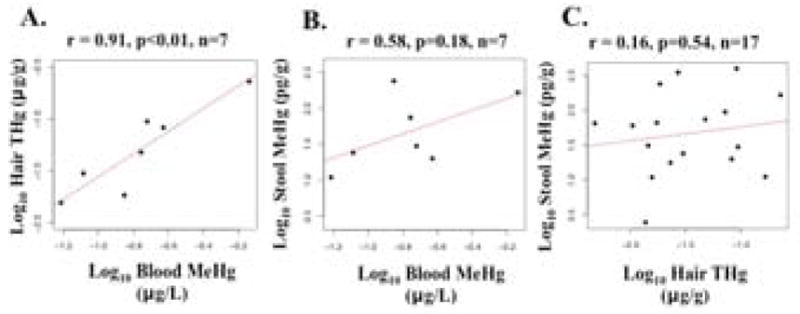
Bivariate scatterplots relating total mercury (THg) or methylmercury (MeHg) concentrations between a) hair-cord blood, b) stool-cord blood, and c) stool-hair, including Pearson’s correlation (rho).
Official websites use .gov
A
.gov website belongs to an official
government organization in the United States.
Secure .gov websites use HTTPS
A lock (
) or https:// means you've safely
connected to the .gov website. Share sensitive
information only on official, secure websites.
Bivariate scatterplots relating total mercury (THg) or methylmercury (MeHg) concentrations between a) hair-cord blood, b) stool-cord blood, and c) stool-hair, including Pearson’s correlation (rho).