Figure 2.
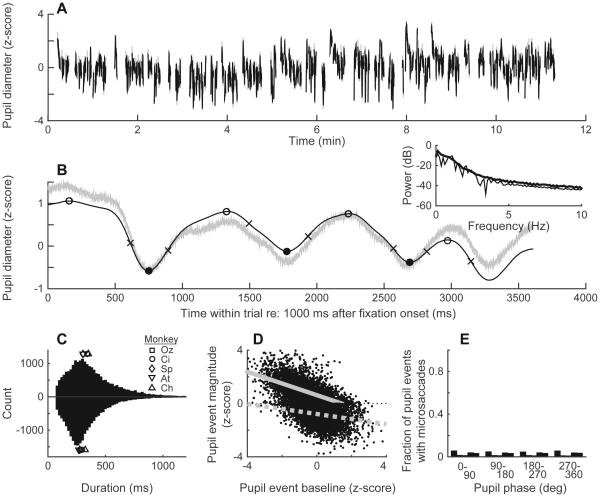
Measuring pupil diameter. (A) Pupil diameter measured during one recording session (Monkey Oz). Only stable fixation epochs used for further analyses are shown; thus, data breaks represent unstable fixations and inter-trial intervals. (B) Single-trial raw (gray) and smoothed and standardized (black) pupil trace during stable fixation. Open and closed circles indicate local maxima and minima, respectively, which define pupil “events.” Crosses indicate the peak slope of the pupil signal between extrema. Inset shows pupil power spectrum (thin line is the example trial, thick line is trial mean for this session). (C) Distribution of pupil event durations for all monkeys and all sessions. Dilation times (intervals between each local minimum and the subsequent maximum) are shown above the x-axis, whereas constriction times (intervals between each local maximum and the subsequent minimum) are shown below it. Median values for each of the 5 monkeys are shown as different (overlapping) symbols, as indicated. (D) Per-cycle pupil event baseline versus fluctuation magnitude, measured for one representative monkey. Gray lines show linear regressions for dilations (solid) and constrictions (dashed). (E) Proportion of pupil events with microsaccades, plotted as a function of the phase of the pupil event in which it occurred (five bars per bin represent the five monkeys, ordered as in the legend in panel C). For all five monkeys, the distributions were uniform with respect to phase (Rayleigh test, p>0.05).

