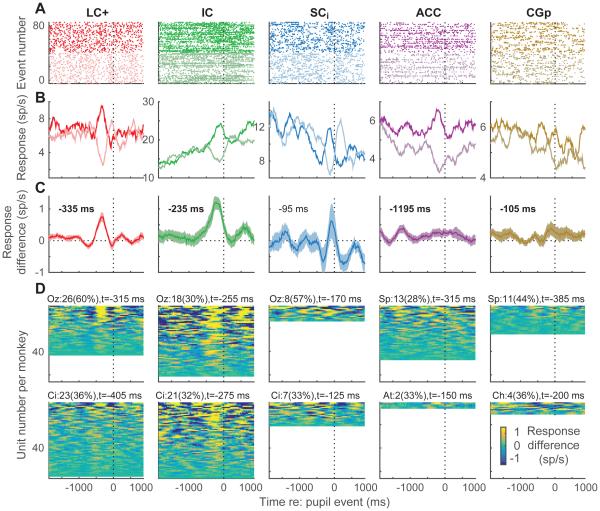
Figure 5.
Spike PETHs aligned to pupil events for each brain region, as indicated (columns). (A, B) Example units. Light/dark lines show rasters (A, showing 40 randomly selected trials for each condition for presentation clarity) and PETHs (B) for large dilation/constriction events (upper/lower 25th percentile slopes; see Fig. 2B), aligned to the time of the event. (C) Mean±sem difference in dilation-versus constriction-aligned PETHs computed for each recorded unit from the two monkeys. The time of the maximum value is shown in each panel; bold indicates H0: the value at that time=0, p<0.05 bootstrapped from the mean±sem values computed per unit for the given time bin. (D) Mean difference in dilation-versus constriction-aligned PETHs computed for all recorded single units, sorted by modulation depth per monkey (top rows show units with the biggest difference between the maximum and minimum values). Text indicates the count (percentage) of sites for each monkey with a reliable peak (defined as ≥75 consecutive bins with at least one bin between 100 ms before and 700 ms after the spike for which real–shuffled was significantly >0, Mann-Whitney p<0.05) and the median time of the reliable peaks. Per-monkey percentages were indistinguishable between LC+, IC, and SCi (chi-squared test, p≥0.05) except for Oz, LC vs. IC. All analyses used 250-ms time bins stepped in 10-ms intervals.

