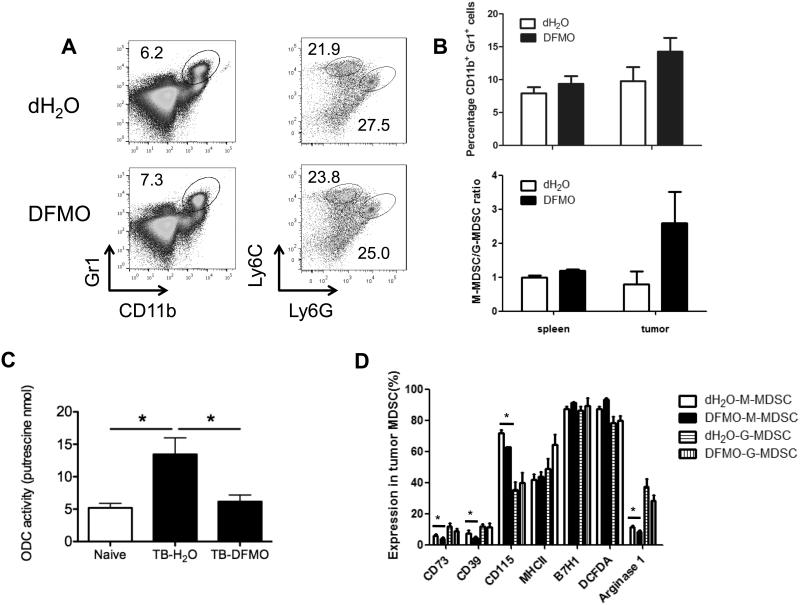
Figure 4. Charaterization of phenotypic tumor-associated MDSCs following DFMO treatment.
(A) Percent splenic Gr1+CD11b+ MDSCs were determined by flow cytometry from B16F10-bearing mice. Percent CD11b+Ly6G+Ly6Clow (granulocytic) and CD11b+Ly6G−Ly6Chigh (monocytic) MDSCs were indicated within plots (5 mice per group). (B) Percent Gr1+CD11b+ MDSCs, CD11b+Ly6G+Ly6Clow (granulocytic) and CD11b+Ly6G−Ly6Chigh (monocytic) MDSCs in spleen and tumor tissues from B16F10-bearing mice were summarized (5 mice per group). (C) Measurement of ODC activity in Gr1+CD11b+ cells from naïve and B16F10 tumor-bearing (TB) mice treated by DFMO or dH2O (5 mice per group). (D) Expression levels of CD39, CD73, CD115, MHC-II, B7H1, DCFDA (ROS indicator) and arginase-I among both tumor-infiltrating CD11b+Ly6G+Ly6Clow (granulocytic) and CD11b+Ly6G−Ly6Chigh (monocytic) MDSCs were determined by flow cytometry. Cells were collected from B16F10-bearing DFMO treated or control mice 14 days after tumor inoculation (5 mice per group). Data (mean ± SEM) are representative of 2 independent experiments. *, p< 0.05.

