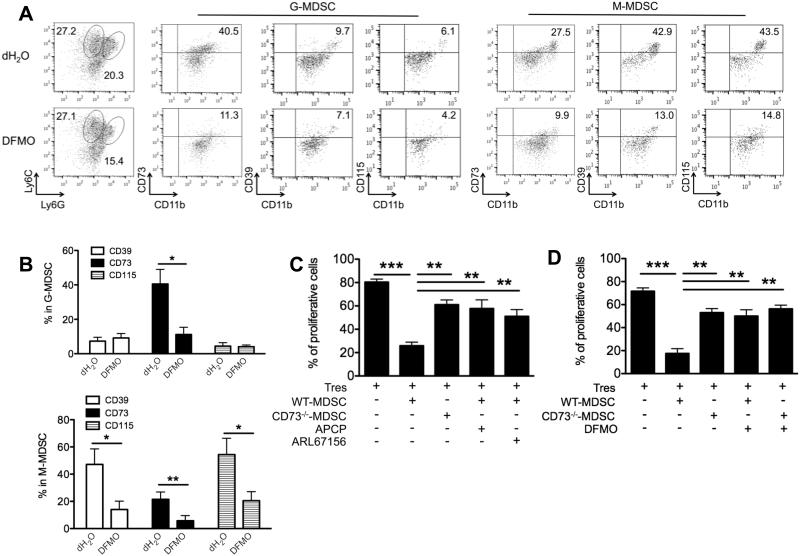
Figure 6. DFMO impairs MDSC function by reducing CD39/CD73-mediated adensinergic effect.
(A) Representatvie flow dot plots show the gating strategy for CD11b+Ly6G+Ly6Clow (granulocytic) and CD11b+Ly6G−Ly6Chigh (monocytic) BM-cultured MDSCs, and the percent CD73, CD39 or CD115 in each MDSC subset treated by DFMO or dH2O as controls. (B) Flow quantification of CD73, CD39 or CD115 expression in DFMO-treated MDSCs versus control MDSCs (5 mice per group). *, p<0.05; **, p<0.01. (C) Suppressive activity of MDSCs as shown by quantification of eFluor450-labeled CD4+ T responder cells (Tres) cocultured with the indicated Gr1+CD11b+ MDSCs treated with or without CD73 inhibitors APCP or CD39 inhibitors ARL67156. The ratio of T cell/MDSC was 2:1. (D) Suppressive activity of MDSCs as shown by quantification of eFluor450-labeled Tres cocultured with the indicated Gr1+CD11b+ MDSCs treated with or without DFMO. The ratio of T cell/MDSC was 2:1. **, p<0.01; ***, p<0.001 (3 mice per group). Data (mean ± SEM) are representative of 2 independent experiments.

