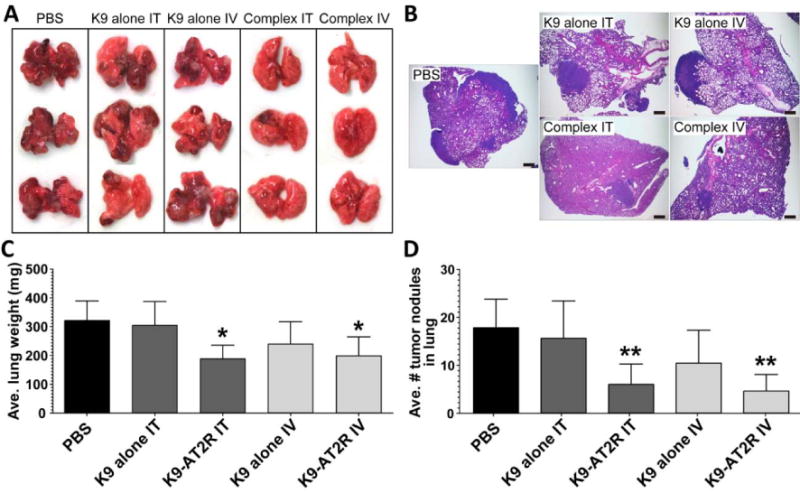
Figure 5.

Macroscopic analysis of LLC tumors in C57BL/6 mouse lungs (A) and microscopic views (B) of the lung from PBS, K9-alone IT, K9-alone IV, K9-pAT2R-Ca2+ IT (complex IT), or K9-pAT2R-Ca2+ IV (complex IV)-treated mice (n=5). Average lung weight (C) and number of tumor nodules (D) in each treatment group were expressed in the bar graphs. Scale bars in panel B indicate 500μm. *, P < 0.05; **, P < 0.01 as compared with the level of PBS control (n=5, one-way ANOVA Tukey post-test). K9, nine amino acid polylysine; IT, intratracheal; IV, intravenous.
