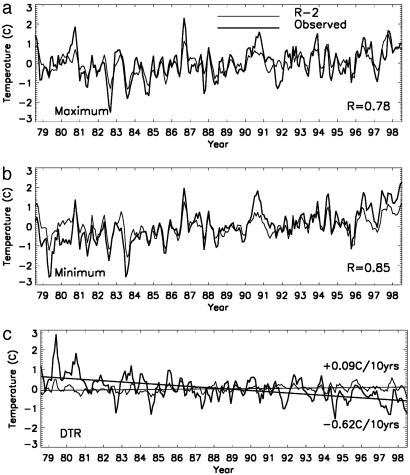
Fig. 1.
Monthly temperature anomalies in the observational and R-2 data for Shenzhen, a city with the fastest population growth in China, from January 1979 to December 1998: maximum (a), minimum (b), and DTR (c). A 3-month smoothing is applied. The correlation coefficient between the two data sets (without smoothing) is shown.

