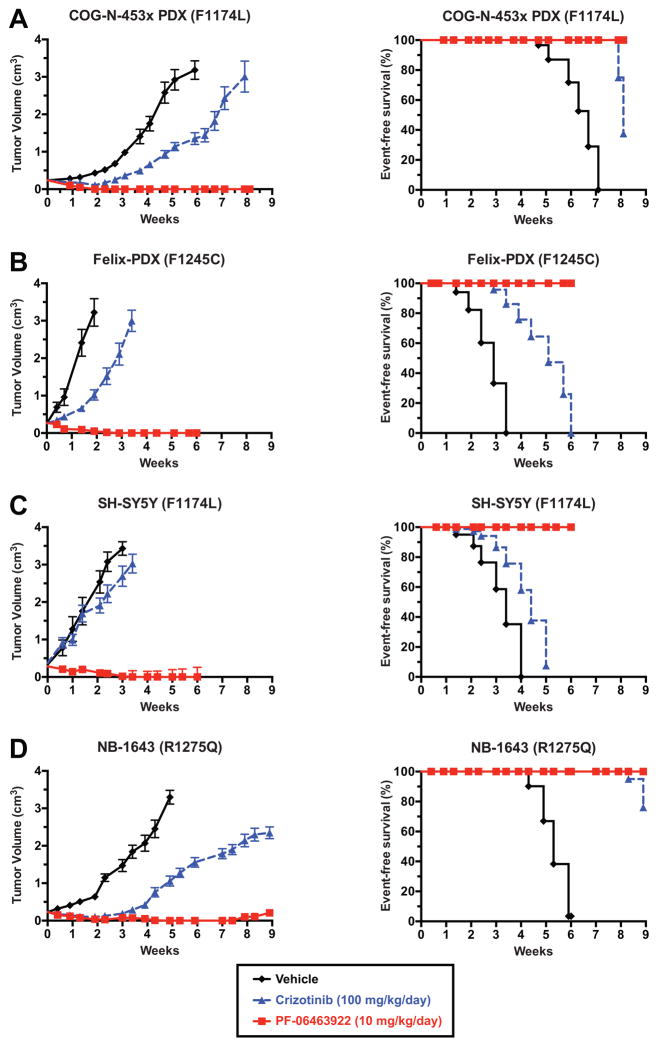
Figure 2.
PF-06463922 induces complete tumor regression in PDX and xenograft models of crizotinib-resistant and crizotinib-sensitive neuroblastoma. Subcutaneously implanted NB tumors were monitored in CB17 scid mice treated with 10 mg/kg/day PF-06463922 (solid red line and squares), 100 mg/kg/day crizotinib (dashed blue line and triangles), or vehicle (solid black line and diamonds). Data are shown only for the duration of treatment in each case. Study end points for survival analysis (right panels) are shown using Kaplan-Meier curves (Median ± S.E.M., n=10 for each data point). A mixed-effects linear model was used for analysis of statistical significance of tumor growth delay. Kaplan-Meier curves for event-free survival (EFS) were compared using a log-rank test, with p<0.05 taken as indicating significance (see Table 1). Additional EFS data for 4–7 weeks beyond the end of treatment are plotted in Fig. S2.

