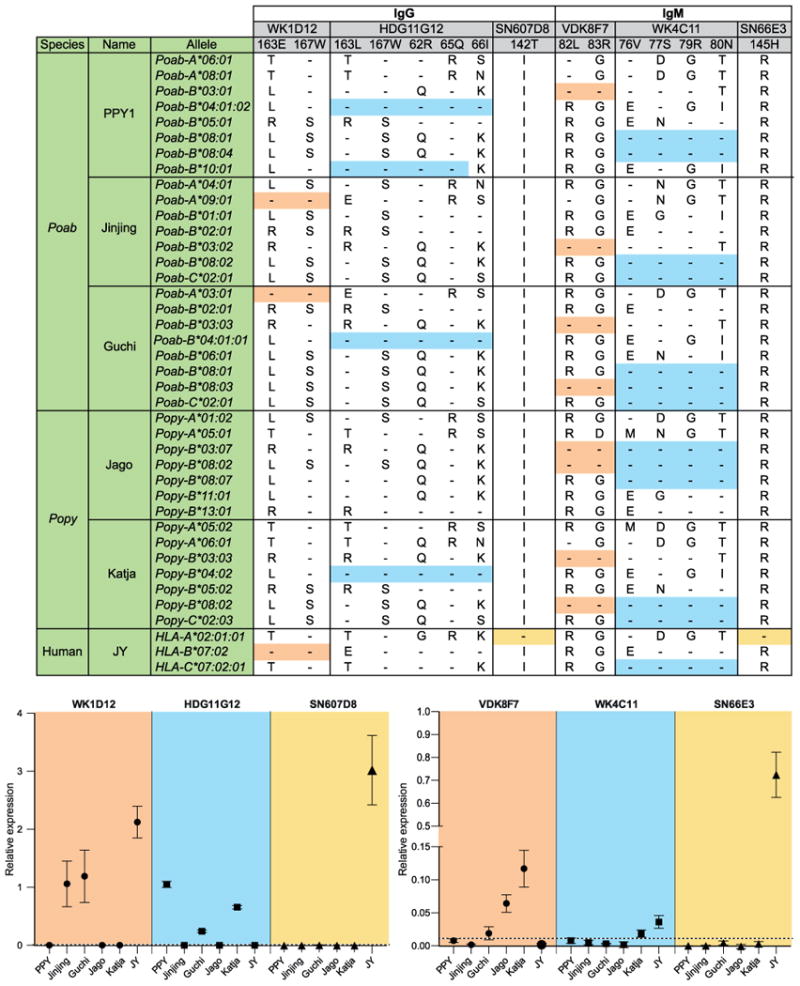
Figure 4. Expression of MHC class I allotypes by five orangutan cell lines defined by six human monoclonal antibodies.

The top panel presents the six human mAbs, and gives the key residues in the human MHC class I sequences that determine the six epitopes and the distribution of those residues in orangutan MHC class I sequences. Identity to the amino acids in the target epitope is indicated by dashes, whereas amino acid replacements are given using the conventional one-letter code. Colored boxes (orange, blue, and yellow) indicate the MHC class I allotypes that have identical or nearly identical amino acids at the epitope-defining positions. In the bottom panel, the relative expression of a MHC class I allotype, as defined by flow cytometry of mAb bound by the five orangutan cell lines, is plotted as the mean with the standard deviation of three experiments. The dotted line represents the threshold value, the point above which all values indicate positive relative expression. The human cell line JY is taken as a control. Poab and Popy signify Pongo abelii and Pongo pygmaeus, respectively.
