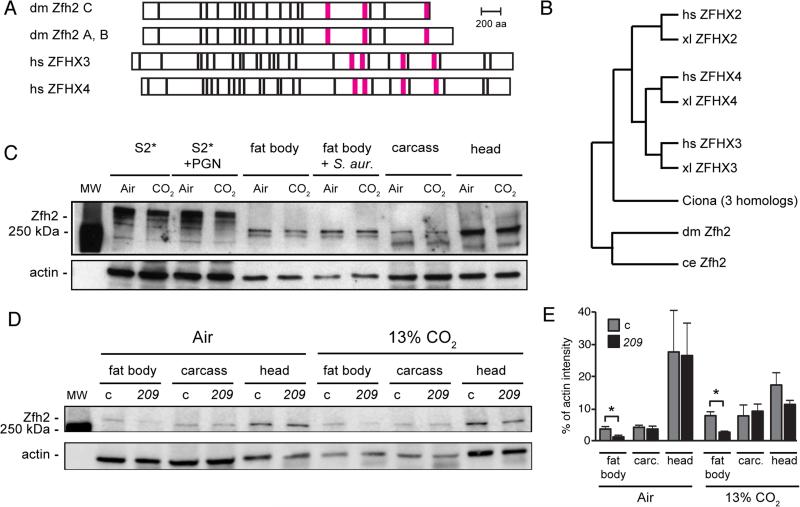
FIGURE 3. zfh2 encodes a large conserved transcription factor expressed in immune tissues.
(A) Domain structure of Drosophila (dm) Zfh2 isoforms A, B and C, and human (hs) ZFHX3 and ZFHX4. Zfh2 isoforms A and B differ by only 2 aa and are shown together. Black bar, predicted zinc finger; magenta bar, predicted homeodomain.
(B) A phylogenetic tree showing the relationships between Drosophila (dm) Zfh2 and human (hs), xenopus (xl), Ciona and C. elegans (ce) zinc-finger homeodomain proteins. The tree was generated using Ensembl Release 81, June 2015 (76), which does not use branch length to represent evolutionary distance.
(C) Western blot using rat polyclonal anti-Zfh2 antiserum (33) shows that Zfh2 is expressed strongly in neural tissue (head), and at lower, but easily detectable, levels in the fat body and the S2* cell line. Zfh2 levels in S2* cells and all tissues appear similar following exposure to air or 13% CO2 and after immune challenge (PGN for S2* cells, S. aureus inoculation for adult flies; see Material and Methods). Fat body, fat body tissue dissected from the abdomens of adult flies (20/lane); carcass, remaining fly body after removal of the head and the abdominal fat body; actin, loading control.
(D) Western blot comparing Zfh2 expression in the fat bodies, carcasses and heads of control (c) and zfh2MS209 (209) mutant flies. Blot was performed using rat polyclonal anti-Zfh2 antiserum (33), with chemiluminescence detection imaged by an Odyssey Fc imaging system (LI-COR Biosciences). Shown blot is representative of triplicate experiments.
(E) Quantification of the bands from the Western blot in panel 3D and two replicates using the LI-COR Odyssey imaging system reveals that in zfh2MS209 flies (209), Zfh2 levels are reduced approximately two-fold in the fat body, but similar in the carcass and head, compared to control flies (c, w1118). carc., carcass; *, p<0.05.

