Figure 1.

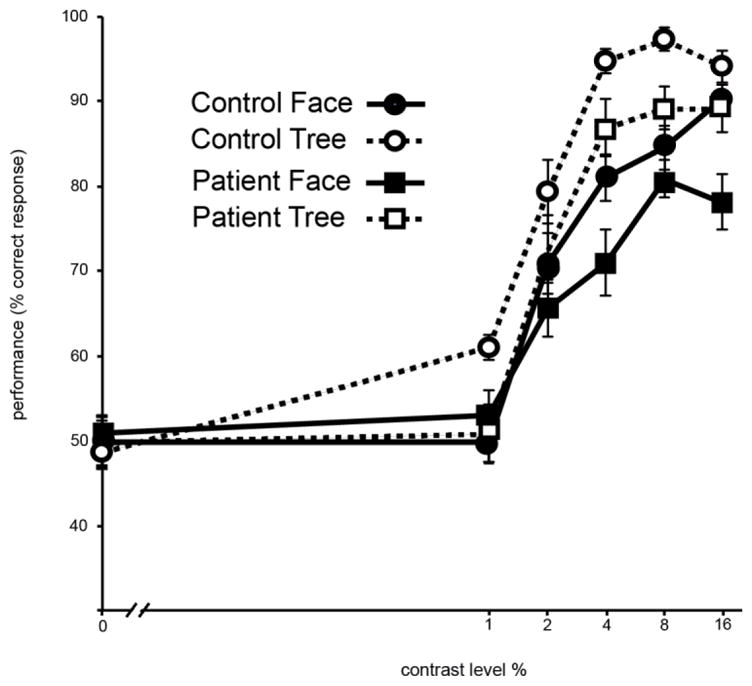
Result of pre-EEG psychophysical testing. Stimulus contrast levels (0, 1, 2, 4, 8, and 16%) are plotted in x axis. Performance accuracy (percents of correct trial) is plotted in y axis. Error bar indicate ±1 standard error.

Result of pre-EEG psychophysical testing. Stimulus contrast levels (0, 1, 2, 4, 8, and 16%) are plotted in x axis. Performance accuracy (percents of correct trial) is plotted in y axis. Error bar indicate ±1 standard error.