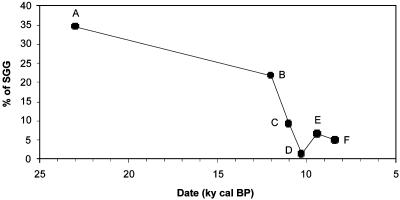
Fig. 2.
Averages, per period, of the percentage of SGG relative to the total grasses at each site. Dates are median dates for each period [A, UP; B, Natufian; C, Prepottery Neolithic A (PPNA); D, Early PPNB; E, Middle PPNB; F, Late PPNB]. The graph shows a decline in SGG from the UP to the Early PPNA and their negligible significance thereafter.

