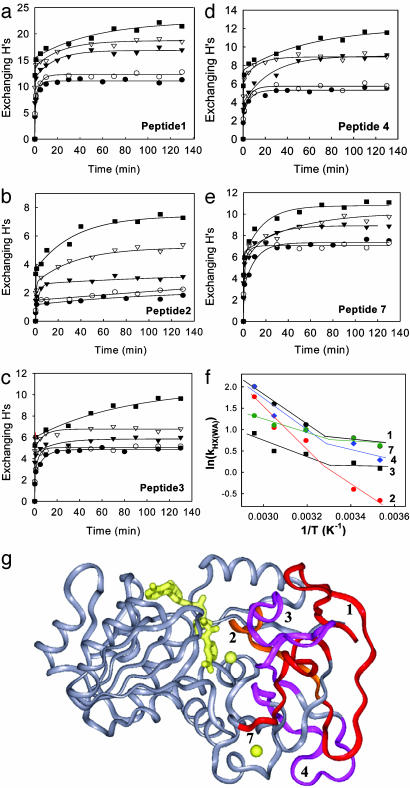
Fig. 5.
Temperature-dependent H/D exchange of the five peptides that show a transition between 20°C and 40°C. (a–e) H/D exchange time course plots for peptides 1–4 and 7 at 10°C (•), 20°C(○), 40°C(▾), 55°C(▿), and 65°C (▪). (f) Plot of ln(kHX(WA)) vs. 1/T. The weight average H/D exchange rate constant kHX(WA) is defined as Ak1 + Bk2 + Ck3)/NH. (g) Structure of htADH monomer. The five peptides exhibiting a transition at 30°C in the temperature-dependent H/D exchange are mapped onto the structure and colored.

