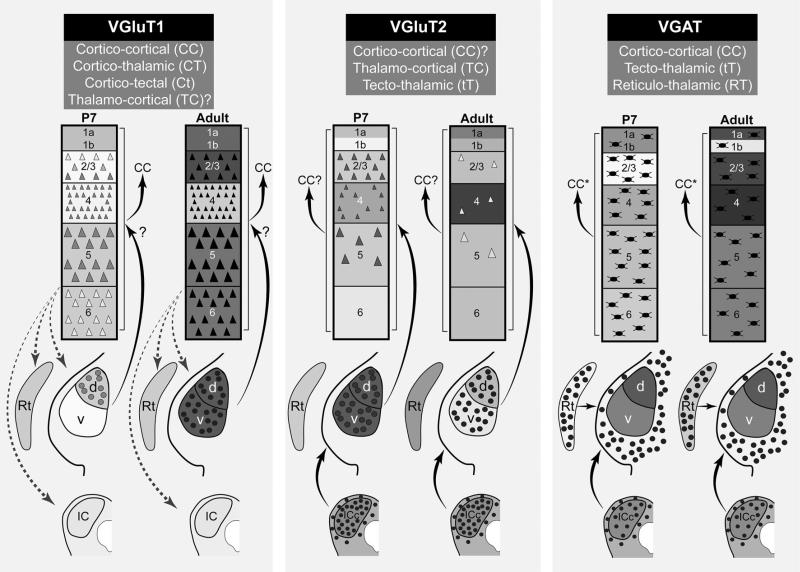
Fig. 25.
Summary of vesicular transporter gene and protein expression in A1, MGB, and IC at P7 and adult for VGluT1, VGluT2, and VGAT. Schematic drawings illustrate relative expression of each marker in cortical layers of A1, MGd (d), MGv (v), Rt, and IC (ICc and adjacent divisions). Gene expression levels of neuronal somata (triangles, circles, ovals) in each structure are indicated by grayscale shading (black highest expression). Protein expression levels are indicated by grayscale shading by cortical layer or subcortical region. For IC and Rt, relative immunoreactivity at P7 and adult were based on qualitative impressions (see Supplementary Figures 26 and 27). Major connections between structures are indicated by arrows. Solid arrows corticocortical (CC), thalamocortical (TC), and tectothalamic (tT) projections. Dashed arrows corticothalamic (CT), corticotectal (Ct), and reticulothalamic (RT) projections. Brackets from L1 to L6 indicate that TC projections are found in all layers. For VGluT2, grayscale shading density by layer is correlated with TC terminal density. Question marks (?) denote connections for which the vesicular transporter involved is not known or is speculative (i.e., VGluT1 TC; VGluT2 CC). Asterisk in the VGAT panel denotes that CC* projections of VGAT are primarily local (some long-range projections exist)

