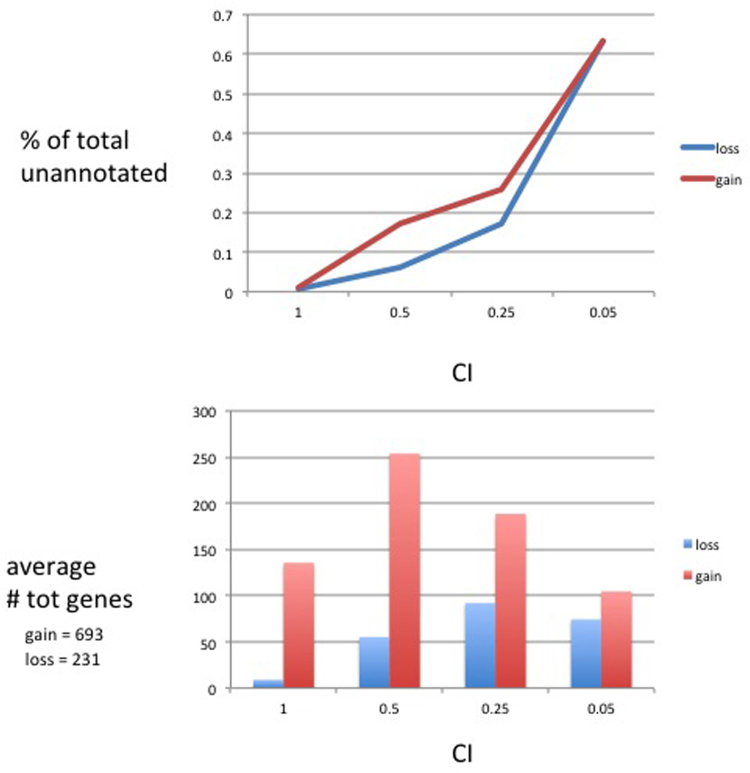
Supplemental Figure 1.
The top figure shows a plot of four consistency index (CI) cutoffs (X-axis) versus percent of unannotated genes that are apomorphies in the data set (Y-axis) for losses (blue) and gains (red). So for instance, 0% of the genes with consistency index=1.0 in the data set are unannotated. On the other hand, for genes that have consistency index of 0.5, losses show 6% that are unnanaotated and gains show 18% that are unannotated. The bottom figure shows bar plots of gains (red) and losses (blue) for four consistency index (CI) cutoffs.

